Energy Musings - September 5, 2023
The media has been focused on the heat dome covering the U.S. and how many record temperatures were set. Houston saw temps above normal but few records, and Rhode Island set cold records.
Weather Versus Climate Change
Climate change is a hot topic (pardon the pun), and not just because much of the country has been living under a heat dome. We have avoided the worst of the nation’s heat waves by spending the summer at our vacation home in Rhode Island. Last week, The Providence Journal posted a headline saying that there had not been any 90-degree temperatures registered officially during June, July, and August at the state’s weather station at T.F. Green Airport in Providence. Wow! We knew it had been a cool summer here, but we were unaware of just how cool it was. The Providence Journal article pointed out that since 1905, only three other years did temperatures fail to reach 90 degrees: 1962, 1951, and 1932.
A local meteorologist said that while the chances of 90-degree temperatures in September are low, the month averages about one 90-degree day. The rarity was September 1983 which experienced nine 90-degree days. The current weather forecast for this week is targeting temperatures to reach 90 degrees for one day before a cooling trend moves in sending temperatures down about 8-10 degrees on average.
All summer, the media reported how these U.S. heat waves were unprecedented. Yes, we had record temperatures in places, but history shows that they were not as pervasive as reported. But for a media intent on accentuating the worst of the weather and trying to link it to climate change, it was not hard for reporters to find one-off episodes of how much people’s lives were impacted by hot temperatures.
Our home in Houston experienced significant heat this summer along with a lack of rainfall. The latter became serious enough that the City of Houston instituted a watering ban in late August, something we don’t remember happening for many years. Population and business growth in Houston and Texas are putting increased pressure on local water systems. In the Houston area, the gumbo soil is sensitive to moisture content, so movement associated with drier conditions can cause water mains to leak or break resulting in thousands of gallons of water being lost. More money and workers will be needed to address this problem. And more rain would help.
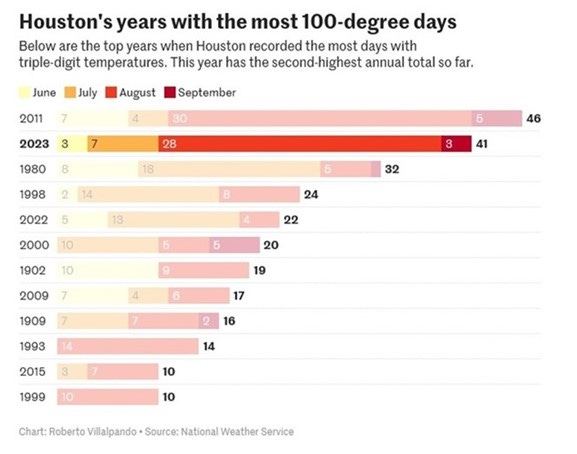
But heat is our focus. A chart from the Houston Chronicle showed the number of 100-degree days in Houston by year. Through September 3, there have been 41 days of century temperatures. That total still trails 2011’s record of 46 days of triple-digit temperature days. Will 2023 catch 2011?
Houston’s summer heat is nearing the record number of 100-degree days experienced 12 years ago.
Interestingly, we have lived in Houston for all those record years except for 1902 and 1909. Those two hot summers occurred well before the surge in carbon emissions that is reportedly responsible for all this heat. Interesting that there were no record years in the 1930s when temperatures nationwide were exceedingly hot.
We are in an interglacial warming period, so it is not surprising that temperatures are rising. But the questions are by how much and what has caused the warming? A new paper from the scientific peer-reviewed journal, Climate, by 37 researchers from 18 countries suggests that current estimates of global warming are “contaminated by urban warming biases.” The paper also looked at the issue of the role of solar activity considered by the Intergovernmental Panel on Climate Change (IPCC) in its latest assessment report.
The issue with urban warming biases is that many of the weather stations used in calculating global temperatures are located in urban areas that are subject to local heating effects. Because urban areas only account for 4% of the global land surface, it supports the IPCC’s estimate in its latest report that urban warming accounted for less than 10% of global warming. This group of scientists estimated the impact may be up to 40% of the warming since 1850. Their conclusion was tied to their assessment that the IPCC underestimated the role of the Sun in global warming since the 19th century as well as the urban heat effect.
The authors of the study analyzed the temperature data only using the IPCC’s solar dataset. They could not explain any of the warming since the mid-20th century. This meant that they replicated the IPCC’s finding that global warming is mostly man-caused. However, when the authors repeated the analysis using a different solar activity estimate – one often used by the scientific community – they found that most of the rural warming and cooling trends could be explained by changing the solar activity measurement. Once again, the IPCC’s bias against considering the role of nature in global warming shows flaws in its climate change conclusions.
What do we know about Houston over the last few decades? It has grown, meaning more people, homes, businesses, retail space, and more vehicles and roads, all boosting the heat generated in the area. As a result, if weather stations remained in their original locations, their temperature readings were likely subject to urban heat effects – reporting hotter temperatures.
The following chart from the National Weather Service shows an interesting record of Houston’s daily temperatures for 2023 year-to-date compared to the normal range and the historical highs and lows. The historical record covers May 1889 through September 3, 2023. The normal period (brown area) is 1991-2020.
Houston’s hot summer set few records, but its winter heat had more days above normal than during the summer.
What you see in the chart is warmer than normal temperatures for June, July, and August, but only a day or two in August when new records were set. According to other data, there were 18 consecutive 100-degree days in August, the longest consecutive stretch in weather records. That’s hot and debilitating.
We also note that there were many days in the January to April period when temperatures were above normal by a wide margin. In some cases, the temperatures reached the historical high for that day. It seems that there may have been almost as many above-normal temperature days in that winter period as there were in the three summer months. The difference was the level of the temperatures in the two periods.
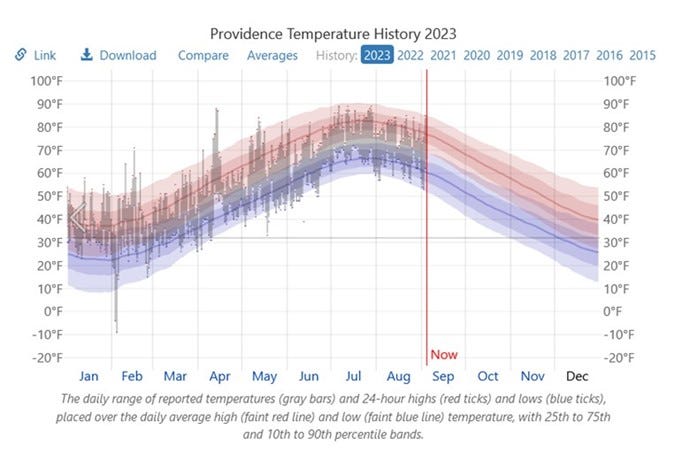
In contrast to Houston’s heat was the cool weather of Rhode Island. The following chart from Weatherspark.com shows similar 2023 temperature data for Providence based on National Weather Service data. The thin solid red and blue lines are the average of the daily high and low temperatures. The shaded red and blue areas represent the 10% and 90% (lightest shade) and the 25% to 75% (darker shade) highs and lows. Once again, the most significant number of daily temperature deviations seemed to come in the first four months of 2023, much like Houston’s record.
Rhode Island temperatures this year reflect a warmer winter period and a cooler summer with no 90-degree temperatures registered during June, July, and August.
The most telling 2023 temperature chart comes from Weatherbell.com, a contract weather service. This chart shows the nationwide temperature anomalies from their historical average for the 90 days of June, July, and August. What we see is how much of the country’s land mass experienced normal (white) temperatures this summer. The cooler (dark and light blue) temperatures were seen in the upper Southeast states, the Middle Atlantic, Ohio basin, and New England regions. Hotter (yellow and orange) temperatures were seen across the Gulf Coast, Texas, New Mexico, and some of Arizona. There were also hotter temperatures in the Pacific Northwest. Since we are dealing with anomalies, the map shows scattered weather stations across the U.S. experiencing either warmer or cooler temperatures but no other geographic concentrations.
For all the talk about record heat waves, this chart shows that the hot and cold temperatures were highly localized.
What we have learned about this year’s temperatures is that there may have been a greater number of warmer-than-normal days during the winter than this summer. While summer temperatures were above normal, they set few records in Houston and certainly none in Rhode Island. We are looking at weather, and not climate change, and we should not confuse the two.


Yes, it was a warm winter everywhere. That was demonstrated by the record highs recorded during Jan-Apr in both Houston and Rhode Island. I see winter forecasts are calling for colder and wetter.
I grew up in CT so was interested in the history of snowfalls. I remembered winters when we shoveled all the time and other winters when we barely shoveled.
While I grew up in Darien, I could only find a history of Hartford snows. My birth year was #1 out of the 93 years with 92.4 inches. Nine years later there was so little snow it ranked #87 with only 17 inches. One high school year was #8 with 78.9 inches. I have fond memories of that winter - not being able to drive up a hill to get my date home. Parked and walked her home. Thanks for giving me an opportunity to remember.