Energy Musings - October 7, 2024
Our third article on ISO-NE's report on decarbonizing its grid delves into how curtailment will boost the transition cost. We also explore how much this effort will cost ratepayers.
This is the third installment of our look at ISO-NE’s Economic Planning for the Clean Energy Transition report. Our first article examined the primary conclusions of the challenges and opportunities for decarbonizing the region’s electricity system. The second article discussed the challenge of completely decarbonizing the grid by 2050. It also considered the impact on the region’s offshore if the grid decarbonization was achieved using offshore wind.
ISO-NE Acknowledges Grid Decarbonization’s High Cost
The Independent System Operator of the New England electricity grid (ISO-NE) highlighted the various opportunities for decarbonizing it by 2050 in its Economic Planning for the Clean Energy Transition (EPCET) report. However, it also pointed out that many opportunities represent challenges especially if renewables are the only option. While EPCET hinted at the high cost, it failed to quantify the price of the various decarbonization strategies.
A conclusion in the EPCET report stated:
“Eliminating carbon emissions through complete electrification of the heating and transportation sectors and a near-exclusive reliance on wind, solar, and storage to generate electric power is possible, but involves significant cost and unresolved reliability concerns.”
That was the first cost warning, but more importantly, the “reliability” issue implies additional costs for ratepayers. The report made two other decarbonization observations. “EPCET results illustrate the highly variable nature of future supply and demand, which result in vast, costly buildouts of renewables that often sit idle.” The report noted that “Reducing carbon emissions requires significant financial investment.” Everything about decarbonizing the grid involves dollars. ISO-NE never attempted to quantify the cost, keeping ratepayers in the dark about future electricity bills.
The entire push to decarbonize the ISO-NE grid involves using “cheap” renewables. The reality, as EPCET lays out, is that they will be “costly” or require “significant financial investment.” More money from ratepayers and higher electricity bills.
Repeatedly, ratepayers are told by regulators and politicians that because wind and solar are “free,” their addition to the grid will bring down the cost of electricity. That is misinformation and a disservice to the ratepayers who will be left holding the bill.
Curtailing Energy Resources And The Economics
A problem with renewables is that they require significant overbuilding of capacity due to their low output factors. When all the capacity is online and delivering power, the grid is overwhelmed and its manager is forced to curtail some of the supply. This scenario is at the heart of negative electricity pricing seen periodically on U.S. grids. Renewables, receiving tax subsidies for delivered power, will cut their offering price to drive more expensive dispatchable and other renewable resources offline.
It has become a cutthroat game since renewables can count on the subsidies to provide another stream of revenue beyond the cost of their energy. However, they only get paid when they deliver power. Therefore, they are incentivized to sell their power even if it means cutting the price below zero. In other words, they are willing to pay someone to take the power. This is one of the most perverse characteristics of the modern grid with growing shares of renewable resources.
EPCET reported that “the expected seasonality of decarbonization means that by 2045, a newly added renewable may run for just 10% of that year. As a consequence, the majority of resource additions in later years will be curtailed (their production will be limited by system operators) for most of the year.”
That is not an attractive scenario for renewable energy developers. Why? They need to use debt to finance their projects, which means they have financial obligations and need the revenue from the sale of output plus the associated subsidies. The latter may be sufficient to meet a developer’s financial obligations, meaning he is incentivized to cut the price of his power to whatever it takes to ensure it is purchased by the grid operator.
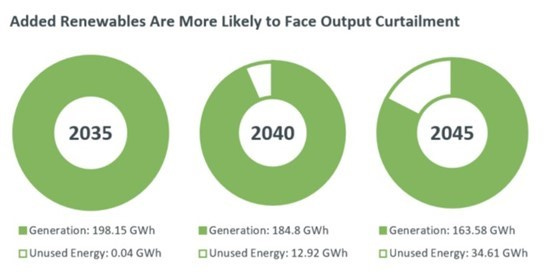
The EPCET report showed how curtailment impacts earlier renewable energy projects as new renewable capacity is added to the grid. The chart “shows how much unused energy a hypothetical land-based wind resource built in 2035 produces in the modeled 2040 and 2045.” From a negligible amount of curtailment in 2035, five years later the wind farm will be unable to sell 6.5% of its initial power output. By 2045, ten years on, the share of power curtailed increases by more than 2.5 times to 17.5%.
More renewable capacity hurts existing projects.
Assuming the wind farm is built using 80% debt and 20% equity, as has been typical for many years, the prospect of losing 6.5% of the revenue in five years and upwards of 17.5% in ten years has financial repercussions. As this scenario is modeled, the developer may elect to hike his electricity price to earn greater income in the earlier years of operation, thereby reducing the financial burden in later years. Or a developer may see the potential of lost revenue as too great a financial burden, so he elects not to build the project. Neither outcome is desirable for the grid or the ratepayers.
EPCET goes to great lengths to explain why the current grid payment system for electricity will become a problem as “the decarbonization of spring and fall significantly outpace the decarbonization of winter.” Currently, generators enter “power purchase agreements” (PPAs) with utilities. PPAs function outside of the wholesale electricity market administered by ISO-NE. PPAs involve an agreement to purchase the generator’s output based on a negotiated price per megawatt-hour (MWh). PPAs are often used to help finance the construction of the generator.
Once a generator is built, it bids into the electricity market. Depending on the terms of its PPA, the price may be low or even negative, which will make the generator’s output attractive. The generator is paid for each MWh of electricity it provides at its PPA price plus the grid’s energy price when locational marginal prices (LMPs) are negative. The example EPCET gave was a generator signing a $20/MWh PPA, which allows it to offer its electricity into the energy market at a price as low as a negative -$19.99/MWh and still receive a positive payment for its electricity. This negative pricing is how power sources with lower costs may undercut more expensive generators, thereby cannibalizing the power market.
EPCET showed what happens in the future to new renewable resources needed to decarbonize the ISO-NE grid in winter. They will struggle to compete with generators who secured PPAs years or decades earlier. The report considered a hypothetical 2040 scenario when the fall and spring seasons are decarbonized because demand is low and renewable supplies are high. An existing wind farm provides electricity to the grid under its $50/MWh PPA. A new wind farm seeks to enter the market. Because of technological and supply chain improvements, its cost is less, so it qualifies for a $45/MWh PPA. However, the new wind farm’s “break-even” LMP is -$45/MWh, higher than the existing wind farm’s break-even LMP of -$50/MWh. Therefore, the new wind farm will be underbid in the energy markets, and will not run in fall and spring when the system has a surplus of carbonless energy.
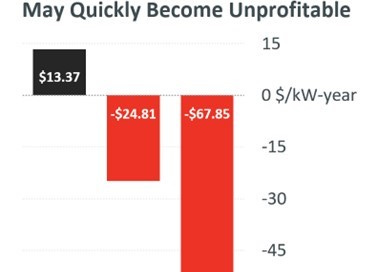
To demonstrate the problem for new renewable energy resources, EPCET prepared the following analysis of a hypothetical land-based wind farm built in 2035, with a PPA of $87/MWh. It is profitable in 2035, the year it was built. However, in 2040 it loses money, which grows more negative five years later. What renewable developer wants to enter a market with such a future loss profile?
Who will build renewables with this profit outlook?
This scenario highlights why ISO-NE is warning that there is a need to consider revamping the compensation system for electricity providers if new capacity is encouraged to be built. EPCET explained possible solutions, but all options will boost electricity prices.
“The absolute PPA price of newer resources could be set higher than those of existing resources. However, under this strategy, older wind resources would be underbid in the energy markets during periods of negative LMPs, which could undermine their revenue sufficiency. Higher PPAs for newer resources may also result in higher costs to ratepayers as the marginal cost of new zero-carbon energy rises. Fundamentally, as decarbonization accelerates, but remains highly correlated with the seasons, zero-carbon resource additions will produce surplus energy for increasing periods of time, and their cost per MWh will rise.”
At every turn, EPCET shows that relying only on renewables to decarbonize the grid means higher electricity prices for ratepayers.
Estimating The Clean Energy Transition Cost
Ratepayers are only concerned about what happens to their electricity bills during the clean energy transition. EPCET warns repeated, as noted above, that the clean energy transition will be expensive, and that power bills will rise. What they don’t tell the public is just how costly this effort will be and how high electricity prices will go. However, ISO-NE’s honesty about rising costs from the decarbonizing mandates contrasts with the green non-governmental organizations, energy regulators, and politicians who continue to espouse that electricity prices will decline with more cheap wind and solar power.
As noted in our earlier articles, EPCET provides ideas about the generating capacity needed by 2050 based on specific development plans such as with offshore wind. In that example, EPCET said it needs a grid of 34 gigawatts (GW) of offshore wind. Depending on the energy density of the development, only the high-density plan falls within the amount of offshore lease acreage available. The medium-density development would need an additional 14.5%, while the low-density plan requires 1.4 times the currently available lease acreage.
In their model, the high-density offshore wind development needs 1,750,000 acres or 2,734 square miles of the ocean to host the wind turbines. The medium-density plan occupies 3,450,000 acres (500,000 more than available) or 5,390 square miles of ocean waters. The most devastating for New England’s offshore is the low-density project, which needs 7,150,000 acres (4,200,000 more acres than currently available) or 11,172 square miles of space with wind turbines. The wind turbines in the low-density development would occupy a 20-mile-wide stretch extending the entire 1,120-mile New England coastline. The extra acreage needed alone would occupy half that stretch. We are not sure New Englanders want their coastline full of wind turbines.
According to the latest estimates from the Energy Information Administration (EIA), the capital cost of bottom-supported offshore wind turbines used in calculating the sector’s levelized cost of energy (LCOE) is $3.7 million per megawatt (MW). This means the 34GW of offshore wind capacity in EPCET’s model would cost $125.8 billion. That does not include the additional transmission cost for delivering the electricity from the turbines to the onshore grid. Because these cables are regulated differently, their cost is embedded in the delivery cost of electricity. Utility companies receive a regulated return on investment in these offshore transmission cable systems, meaning ratepayers are paying for the cost over the years. Given the regulatory process, it is often impossible to know exactly what these transmission systems cost and their impact on ratepayer monthly bills.
A 2022 analysis by the National Renewable Energy Laboratory of the cost of electricity systems suggests that the electricity infrastructure for a bottom-supported offshore wind project represents 16% of the LCOE estimate. If we use that percentage of the $125.8 billion development cost of the New England offshore wind system, the transmission cables would cost an additional $20 billion. That would boost the total offshore wind development scheme to roughly $146 billion.
Another way of looking at the cost to ratepayers is to examine the recent offshore wind projects awarded by New York State. These projects previously had their PPAs approved by the state regulator. However, the developers opted out of their agreements with the utilities buying the power as project costs escalated making them uneconomic. The developers were allowed to cancel their PPAs and rebid the projects in the 2024 offshore wind power solicitation.
The two projects selected have prices of $150/MW, double the prices negotiated in their canceled PPAs. The price translates into a $0.15 per kilowatt-hour electricity cost for ratepayers. We do not know what the energy cost of electricity is for the New York utilities that will purchase this power. We also do not have the transmission cost to bring this power to shore. What we can do is relate the energy cost to our electricity bill in Rhode Island. According to our September bill, the energy cost was $0.10377/kWh, making the New York offshore wind electricity cost 50% greater than in Rhode Island. As the higher cost of the offshore wind will be blended in with the existing cost structure of the New York utility, the impact on the monthly bill will be muted by cheaper power supplies. However, the media is reporting that New Yorkers are outraged at the high cost of offshore wind electricity.
Another Future Cost Estimate
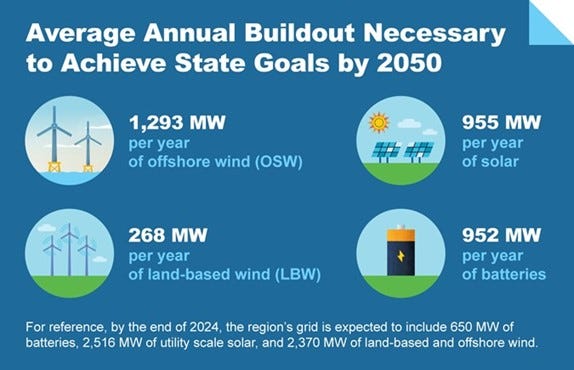
To meet the various state decarbonization goals, EPCET estimated how much new renewable energy capacity would be needed to be added to the grid. This exercise assumes only renewables and batteries are added. Here is the EPCET chart.
An expensive way to supply energy in 2050.
In our first article, we wrote the following analysis of this chart.
“Using the latest capital cost estimates from the Energy Information Administration’s Annual Energy Outlook, we find the batteries needed by ISO-NE will require an annual investment of $1.25 billion. Additional solar power will cost $1.27 billion annually, with onshore wind adding $460 million. The most significant renewable cost is offshore wind at $7.81 billion annually. Therefore, ISO-NE’s renewable energy capacity additions will cost $10.79 billion annually, or $270 billion over the next 25 years. Ratepayers will be on the hook for this investment.”
Our estimate does not include the cost of rebuilding renewable assets that wear out before 2050 and must be replaced to reach the total capacity addition required. Wind turbines and solar panels have estimated useful lives of 15-20 years. However, since we are forecasting the system buildout cost over the next 25 years, it is likely all the existing renewable assets built in the next few years will need to be replaced, as well as all the existing turbines and panels already operating. Therefore, we would need to increase our estimate.
ISO-NE Load Forecast Signals Transition Cost To Be Higher
Early in the EPCET report, ISO-NE discusses the need for dispatchable resources to meet future energy needs. This need comes from the changing nature of power demand and the inability of the current energy compensation system to ensure adequate generation capacity is available. That discussion led with the following caption.
“1.2 The large variation in peak demand will require vastly different supply from year to year. Some years will require all resources to operate. In other years, certain resources will run for just for a few hours, or not at all.”
As EPCET built its energy demand model, it relied on the 2022 Forecast Report of Capacity, Energy, Loads, and Transmission (CELT) for estimates for the initial 10-year period. For the years beyond the forecast, the report relied on profiles generated by the ISO Load Forecasting team.
EPCET states: “If actual peak demand levels in future years are lower than these forecasts, overall variability among years will decrease, and fewer resources will be required to ensure reliability, reducing overall system costs.”
This is an encouraging outlook, especially since the need for dispatchable resources to fill supply gaps does not necessarily coincide with periods of high demand. Rather, the gaps occur during those hours when wind and solar resources produce less output due to weather, and battery storage is depleted. Those gaps are identified by modeling future demand loads under the 20 years of New England weather for 2000-2020.
What EPCET never gives us is their actual demand forecast, since they are incorporated in the separate analyses for renewable and dispatchable resource demand. Therefore, we scoured the report for the various estimates of demand and supply used in discussing the different energy resources.
Under EPCET’s discussion of variable electricity demand due to annual weather differences in the decarbonized grid, we are told the 2040 demand range is 30-41.5GW, and in 2050, it is 40-60GW. Additionally, under EPCET’s dispatchable power needs discussion, the annual capacity needing to be added was greater than 1,000MW. Such a growth rate enables grid capacity to grow from 30GW in 2025 to 55GW in 2050.
If we utilize the annual renewable resources capacity additions, the total of solar, onshore, and offshore wind added to the grid by 2050 would grow the grid to 62.9GW. Adding that growth to the 5.9GW of existing solar and wind capacity, the 2050 grid would be nearly 70GW. These estimates do not include the required 23.8GW of new battery capacity. Adding the existing 650MW battery capacity with the newly required capacity, the 2050 grid grows to nearly 95GW.
Another future grid size comes from EPCET’s 2050 Base Policy Scenario. It assumes an all-renewable energy grid of solar, wind, and batteries. EPCET says this grid needs 97GW of generating capacity. EPCET further says the grid can shrink if synthetic natural gas (SNG), primarily hydrogen, displaces the need for renewable capacity. Hydrogen is a carbonless dispatchable fuel, but it is extremely expensive. Using SNG supplies is estimated to cut the grid size by 37%.
Additionally, if Small Modular Reactors (nuclear power) are added for baseload power, the grid size using both SNG and SMRs could shrink by a total of 57%, or from 97GW to 62.3GW. (Sorry, we cannot make the math work to the statements about how much less win, solar, and battery storage would be needed.)
Using these energy supply options, given their significant dispatchable capacity factors, is probably why EPCET says the reduction in renewables is greater than the MW figures they put in their chart. SNG and SMR can help balance the grid by decreasing curtailments and the amount of renewable resources needed. Whether the cost to achieve this balance would be less than overbuilding the grid depends on assumptions about the cost of hydrogen and SMRs versus those for wind, solar, and batteries.
Even EPCET is not sure that these options are the most cost-effective solution. It wrote the following analysis.
“Fossil fuel-burning resources may also be more competitive than zero-carbon fuels like SNG under current market structures. The EPCET model’s assumed SNG price is $40/MMBtu, and cost assumptions for hydrogen in similar studies are around $30-35/MMBtu. Current prices for natural gas are around $2-6/MMBtu, and oil prices typically range between $10 and $20/MMBtu. Absent a carbon price or a Renewable Energy Credit (REC) for the zero-carbon fuel, the zero-carbon fuel may be less economical than carbon-emitting fuels.”
Once again, EPCET presents an expensive and questionable scenario for mitigating the need to vastly overbuild the grid with renewable energy resources. Ratepayers will need to dig deep into their pockets to pay for such a scheme.
In assessing the size of the future grid, there are other unknowns. For example, we are never told whether the grid numbers used in EPCET represent gross or net power demand figures. Net demand is derived by using energy efficiency measures to eliminate demand.
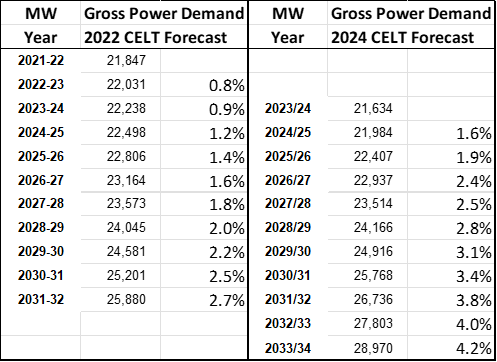
We used the 2022 CELT forecast to estimate annual power demand that gets us to a 60GW gross demand by 2050. The two-year EPCET study employed the 2022 CELT demand forecast. We examined the ISO-NE 2024 CELT forecast to see how demand was tracking with the 2022 forecast.
According to a May Utility Dive article discussing the release of the 2024 CELT report, the author noted that ISO-NE expects a 17% increase in annual energy use by 2033. That growth will be driven by growing numbers of electric vehicles and heat pumps in the region.
Total annual energy use increases from 119,000 gigawatt-hours (GWh) in 2024 to 140,000 GWh in 2033. EVs will represent 11% of 2033 demand, up from the three-tenths of one percent they account for now. Heat pump demand is projected to represent nearly 6% of demand in 2050, up from 0.5% now.
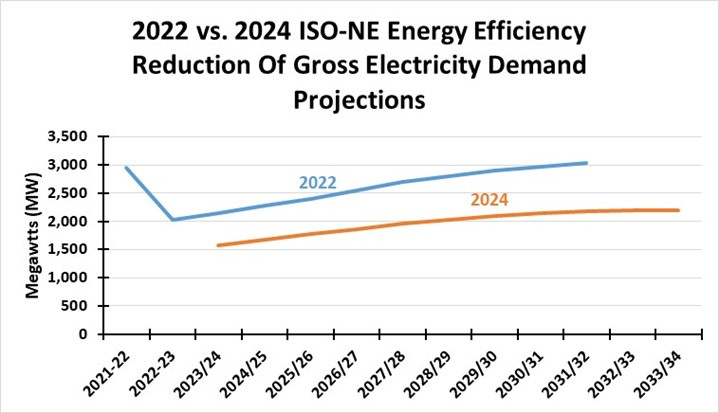
We were shocked when we examined the 2022 and 2024 CELT forecasts. While two years of additional data should provide a better forecast, the accelerating growth in the 2024 demand forecast is shocking. The following graph shows the 10-year forecasts for gross power demand in the 2022 and 2024 CELT reports. The 2024 forecast begins lower than the 2022 forecast, which suggests that ISO-NE was more optimistic about electricity demand in 2022-2024. However, the chart shows much faster electricity growth in the current forecast. How much of that faster growth comes from assumptions about a faster embrace of EVs and heat pumps is unknown. The comments from the Utility Dive article suggest it is the major driver in the new forecast.
Faster electricity growth – more EVs and heat pumps?
EVs and heat pumps are listed as important energy efficiency technologies that are expected to help temper electricity demand growth. However, why is there such a dramatic decline in energy efficiency impact on net demand between the 2022 and 2024 CELT forecasts? We also found it interesting that the 2024 energy efficiency growth flattens and grows very slowly in the final five years of the forecast.
Why has energy efficiency dropped in two years?
To show how dramatically different the 2022 and 2024 load forecasts are, we compiled the following chart comparing the annual growth rates of gross power demand for the two forecasts. In the 2024 forecast, annual growth rates begin about 0.4% and 0.5% per year higher than the comparable years of the 2022 forecast. However, by 2031-32, the 2024 forecast is growing gross power demand by more than a percentage point above the 2022 forecast growth rate.
New England’s electricity demand is growing faster than projected in 2022.
We followed the annual gross demand growth profiles of the two forecasts to project future grid demand. This gave us a gross demand of 60GW in 2050 based on the 2022 forecast. In contrast, the 2024 forecast growth pattern lead to a 70GW gross demand figure in 2050. Trying to reconcile these forecasts proved too time-consuming.
Conclusion
ISO-NE’s EPCET report warns of the cost of a vast overbuilding of grid capacity using renewable resources. It also questions whether the current electricity pricing structure can work in such an energy world. These are warnings that few people in New England hear. The fact that EPCET issues the warning multiple times in a 27-page report should be a huge red flag that ratepayers will be handed an enormous bill for a grid design they were never asked about.
Yes, regulators, politicians, academics, and the media will tell the public that climate change is an existential threat and it justifies spending whatever to prevent the fallout. However, the Bureau of Ocean Energy Management (BOEM), which regulates the offshore wind program, notes in its reports approving new wind projects that they will not reduce carbon emissions. In the future they hope this carbonless energy will eventually displace fossil fuels. They never acknowledge how expensive offshore wind is becoming. Nor do they recognize the need for dispatchable resources (fossil fuels) to keep the grid operating when the wind disappears.
We are uncertain which ISO-NE grid will be built. Using the EPCET chart of the renewable resources and battery capacity additions needed annually by 2050, we estimated it will cost $270 billion. Putting the cost into perspective, currently, there are 15.1 million people residing in New England. Building the EPCET grid will cost every resident nearly $18,000. This estimate is in current dollars, so future cost increases for equipment and labor over the next 25 years are ignored. They will likely be material, pushing up our cost estimate. This investment will be recouped through higher electricity bills, suggesting rates will more than double. The impact of more electric vehicles and heat pumps on homeowner electricity usage will further increase monthly bills. This clean energy transition will be expensive.
The International Energy Agency, in a new report on the progress of the world’s clean energy transition, said, “greater capacity does not automatically mean that more renewable electricity will clean up the world’s power systems, lower costs for consumers and slash fossil fuel use.” ISO-NE’s EPCET report echoes those same points.
During the clean energy transition, New England will be building a second grid system, or it will have to overbuild renewable resources vastly while hoping there will be sufficient power at all times. That gamble is a risk for ratepayers as they may experience blackouts since EPCET demonstrates that renewables cannot produce electricity for every hour of every day in 2050. EPCET stated wind and solar will only meet 10GW of the estimated 51GW demand in 2050. Additionally, the report states that dispatchable resources will become more valuable as we move closer to 2050 while renewable values decline. Furthermore, all energy resources may be subject to curtailment because of the nature of power delivery. That may make developers hesitant to build new generating capacity given that facilities will not be at risk of not generating sufficient income to cover the investment.
Using the current $0.15/kWh cost of New York’s offshore wind power as a guide, it is 50% more expensive than the cost of the energy component of Rhode Island’s electricity. While we do not have similar data on the other states in New England, we suspect they have comparable energy costs. Given the rapid escalation over the past few years in the cost to build renewable energy projects, expecting their future costs to decline is sheer speculation. That is not how we should be planning the grid’s future.
Decarbonizing the New England power grid is an admirable goal. Doing it at the cost of impoverishing the residents is a despicable act.

