Energy Musings - October 26, 2023
Examining the exhibit for the PUC hearing November 6 offers interesting bits of data about the Revolution Wind 2 bid. Our estimate of customer bill increases may be high, but not by a lot.
Revolution Wind 2 Bid Rejection Analysis – Part 3
In Part 1, we outlined the multiple problems with Bay State Wind’s 884-megawatt (MW) bid in response to Rhode Island Energy’s (RIE) Request For Proposal for offshore power. Bay State Wind is a joint venture of Danish developer Ørsted and New England utility Eversource. It was the sole bid submitted in response to RIE’s RFP for between 600 MW and 1,000 MW of offshore wind power. Following a four-month evaluation by RIE, in conjunction with the staff of the Public Utilities Commission and the Rhode Island Department of Energy Resources, it concluded not to go forward with a contract. Their conclusion was based on the failure of the bid to satisfy various requirements of the state’s Affordable Clean Energy and Security Act (ACES), principally that the project delivers cheaper energy. RIE determined that on a gross basis, the contract’s cost to Rhode Island customers would be more than $3 billion. Even after modeling various sensitivities, the net cost would be $1.78 billion.
In Part 2, we attempted to use the cost estimates and a few other contract details to assess the financial impact on customers. Our analysis utilized 2022 data for Narragansett Electric Co., the operating company of RIE. We found that for all customers of RIE – residential, commercial, and industrial – their monthly electric bill averaged $157. We estimated that residential customers had an average monthly bill of $136. Before starting our analysis, we contacted RIE seeking additional information about the bid analysis and the company’s PUC filing mandated by the decision that the bid was non-commercial. The PUC will hold a hearing about the evaluation and RIE’s conclusion on November 6.
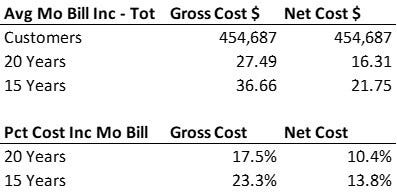
Under the gross cost estimate, bills would increase by $27-$37 per month depending on whether the contract was for 15 or 20 years, increases of 17.5%-23.3%. The net cost was less painful with monthly hikes of $16-$22, or 10.4%-13.8% increases. Double-digit dollar and percentage increase in monthly bills would be painful for most residents, and push more people into energy poverty. We said that if our estimates are close, then RIE should reject the contract. This would not be cheap power!
Our estimates of impact on Rhode Island Energy customer monthly bills may be too high, but the proposed contract is still too expensive according to the utility company.
Subsequently, we received information from RIE indicating it currently has 505,000 customers, which is up from the Energy Information Administration’s website data for the company that listed 455,000 in 2022. That is an interesting increase in a state where the population struggles to remain static.
Using that customer count, power sales data, and revenues, we estimated a residential customer average monthly bill of $135.39. It is response, RIE said a typical residential customer using 500 kilowatt-hours (kWh) of power would have a monthly bill of approximately $167. We assume part of that higher estimate stems from more expensive power purchased by RIE with the cost passed directly on to customers. RIE also provided us with rough estimates of monthly bills for commercial customers using 1,000 kWh for $314.06; 1,500 kWh for $462.26; and 2,000 kWh for $610.44. We had estimated all commercial customers in 2022 had an average monthly bill of $319.27.
This additional information suggests our estimated customer impact from the rejected offshore wind power contract would be lower because of the already higher average monthly bills. Since we will not have 2023 revenue data until early next year, we cannot calculate the monthly averages. Percentage wise, our increase estimates would be lower assuming the 2023 average bills are consistent with the numbers RIE provided us. Our guess, and it is a guess, is that our monthly percentage increases are a couple of percentage points too high. However, we doubt the cost increases would fall into single digits in either dollar terms or percentage increases.
We believe it would be an effective presentation at the PUC hearing for RIE to translate the gross and net cost estimates into a monthly bill impact. That might require disclosure of confidential information that the commission and RIE do not want to or cannot reveal. Our best guess is that any discussion will couch the monthly hikes in terms of single- or double-digit amounts, and then be characterized as in the upper- or lower-end of the range. Euphemisms in testifying and questioning involving confidential information, when the respective parties know the actual data, will be employed to deliver the message about how costly the contract would have been. We will be listening for such messages.
What else did we learn from the RIE filing?
The exhibits to the pre-filed 173 pages of testimony of RIE officials consisted of 966 pages. It included the RFP spelling out the terms of the bid and the information needed from the bidder. That information consumed 110 pages. In the RFP, we found the following requirements for the contract.
requirements for approval by the PUC:
(a) the project must be “newly developed offshore wind capacity”.
(b) the project must be qualified as a “newly developed renewable energy resource”.
(c) the PPA must be commercially reasonable.
(d) the requirements for the solicitation must be met.
(e) the PPA must be consistent with the achievement of the state’s greenhouse gas reduction targets under the 2021 Act on Climate.
(f) the PPA must be consistent with the purposes of the ACES; and
(g) regardless of location, the project must improve energy system reliability and security; enhance economic competitiveness by reducing energy costs to attract new investment and job growth opportunities and protect the quality of life and environment for all residents and business. R.I. Gen. Laws § 39-31-2.
Additionally, the project must operate in a designated wind energy area for which an initial federal lease was issued on a competitive basis after January 1, 2012. The project must be located on the Outer Continental Shelf and no turbine may be located within ten (10) statute miles of any inhabited area.
It is interesting to learn about the requirements for the delivery of the power and that RIE was not accepting responsibility for anything having to do with the delivery.
It is the bidder’s responsibility to satisfy the delivery requirement. The delivery point must be an existing onshore ISO-NE PTF and located so that Rhode Island Energy is not responsible for wheeling charges to move energy. Rhode Island Energy will not be responsible for any costs associated with delivery other than the payment of the contract price.
Both of the above requirements highlight why the pre-filed RIE officials’ testimony listed the numerous items of the contract requirements where they believe Bay State Wind failed to provide adequate information that jeopardized the operational date and even the feasibility of the project. Since RIE would be obligated to purchase offshore wind energy in compliance with the contract and its obligation under Rhode Island’s clean energy mandate, the officials were particularly concerned with a failure to perform. They were less worried about the cost of delivery or meeting other conditions if those costs were not part of the delivered cost of the energy. Given today’s offshore wind market turmoil, those costs could become an issue and RIE might be forced to assume some of them and pass the costs along to customers who would be very unhappy.
Another portion of the exhibit included the transcript of the questions submitted by bidders and RIE’s answers at the meeting before bids were submitted. There was a 46-page PowerPoint presentation made by RIE at that pre-bid meeting.
The final 206 pages of the exhibit were the evaluation prepared by RIE’s economic consultant and its power market modeling that shaped the economic conditions. Much of the evaluation details were redacted, but there were a few data points that we were able to use to discern more about Bay State Wind’s bid. (More on that later.)
The Bay State Wind bid proposal consumed 600 pages of the exhibit. Many of the pages were entirely redacted – just pages of black. Included in the proposal were 145 pages of media articles discussing the project’s developers and their successes in the offshore wind business. We assume that material was to impress the evaluators, the PUC commissioners, its staff, and the other Rhode Island officials and staff participating in the bid evaluation.
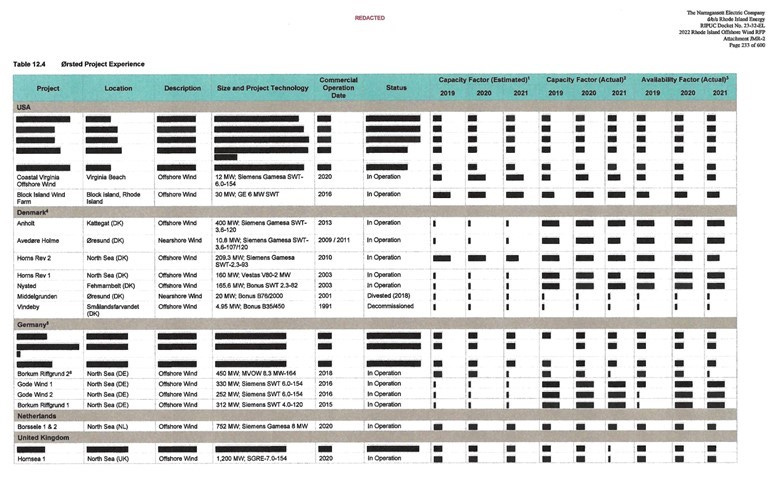
Included was a two-page table listing Ørsted’s global offshore wind projects either operating, under construction or divested/decommissioned. The columns of the table list the project name, location, description, project size, its technology (MW, turbine size, and turbine manufacturer), the date of commercial operation, and its current status. Many offshore wind projects were completely redacted, which we assume are ones currently under development.
There were three columns of data listing each project’s capacity factor (estimated), capacity factor (actual), and availability factor (actual). Under these headings were three columns listing the data for 2019, 2020, and 2021. The data for these columns was redacted. Surprisingly, the redactions also Included the footnote explanations listed at the end of the second page. Therefore, we do not know what the numbers are or how the data and percentages were calculated.
The two U.S. offshore wind farms owned by Orsted redacted the output data and performance, but the information is reported by the U.S. EIA.
Page two lists more Orsted North Sea offshore wind farms, but still redacts the output data, but probably still available from government sources.
The first page lists Ørsted’s offshore wind projects in the U.S., Denmark, Germany, the Netherlands, and the U.K. In the U.S. listing there are seven projects, only two – Coastal Virginia Offshore Wind and Block Island Wind Farm – are identified. These are currently operating wind farms. The data about the amount of power coming from these projects and their capacity factors (utilization) is redacted, however, it is reported monthly to the Energy Information Administration, which makes the data publicly available. (We wondered if Ørsted officials preparing the bid even realized that fact?) A quick Google search of European government sites suggests it may be possible to obtain the output data and capacity factors of many of Ørsted’s other offshore wind farms.
Why the secrecy? It may be because Ørsted wants to perpetuate the idea that offshore wind turbines are producing all the energy they are rated for. We know that is not true. Studies have shown that to produce the nameplate capacity of a wind farm, developers must build twice or more that capacity number! That is because offshore wind is a part-time energy source.
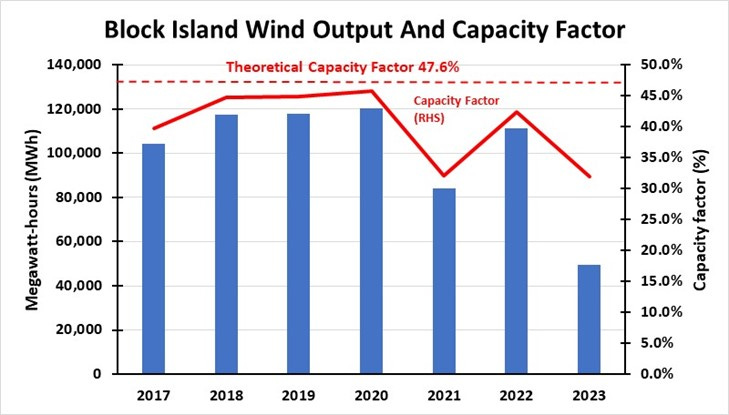
We know from covering the Block Island Wind Farm project that GE (turbine supplier) and Deepwater Wind (developer) told the public and utility regulators the five 6-MW turbine (30 MW) wind farm would produce “more than 125,000 MWh” annually. That would represent a 47.6% capacity factor, based on 100% availability. When Ørsted bought Deepwater Wind, Block Island Wind’s capacity target was cut to 100,000 MWh annually. Convenient from a public relations point of view. Maybe Ørsted based its purchase decision on the lower output target, but that does not erase the proclamations by GE and Deepwater Wind of the higher output target because that was part of the narrative of why the public and Rhode Island regulators should have supported the approval of the high-priced energy.
Block Island Wind has never met the original output target annually. With the reduced target, it has overachieved. That is how you build a positive narrative which will be supported by the local environmental reporters. They dismissed our questioning of why they accepted the lower number despite the history of GE and Deepwater Wind press releases to the contrary. This is what “bought and paid for” means for local readers.
The chart below shows the annual performance of the Block Island Wind Farm. In no year has the wind farm met the capacity factor suggested by GE and Deepwater Wind.
BIW has never reached the target output advertised when it was being considered for approval and until it began operations. Under new owner Orsted, the target was lowered so it now overperforms.
The next chart shows the monthly output for Block Island Wind demonstrating the seasonality of its output. Fortunately, it is most productive during the winter when the power is needed because ISO-NE, the New England region’s grid, loses access to huge natural gas supplies that are diverted to home heating and not available for power generation.
Fortunately, the high power output months are in the winter when New England needs the extra power because it loses access to natural gas supply diverted to home heating.
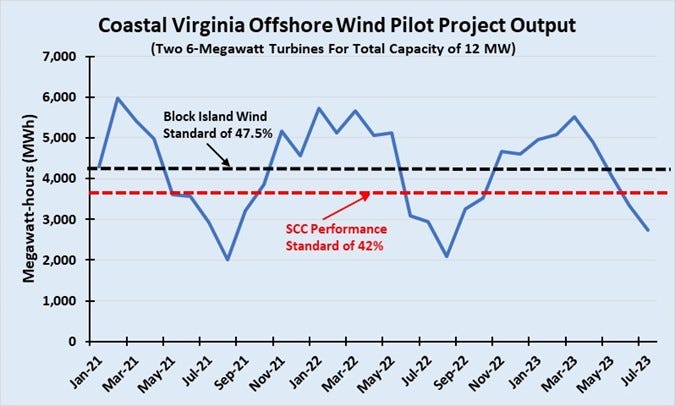
The Coastal Virginia Offshore Wind farm – a two 6-MW turbine project – has only been operating for three years. It was designed as a pilot project for a much larger project for which Dominion Energy has secured approval to develop. The $9.8 billion project was the subject of intense negotiations and the company’s rejection of the initial approval because it included a minimum 5-year average performance requirement. The state wanted a guarantee that the project would produce 42% of its nameplate capacity on average over five years or Dominion Energy would be on the hook for the cost of the power needed to offset the shortfall. The performance standard was rejected by Dominion Energy who subsequently negotiated a cost-sharing arrangement with customers that protects them from huge cost overruns. We are now hearing that the project’s cost may have ballooned to $12 billion.
Interestingly, after the revised project was approved, Dominion Energy reiterated its estimate that CVOW’s levelized cost of energy (LCOE) would be $89/MWh. The Virginia State Corporation Commission staff estimated the LCOE at $125/MWh. If the project will cost $12 billion, the SCC staff estimate will be closer to the reality facing Virginia ratepayers. We will learn the cost when the project is ready for operation and Dominion Energy requests approval of its rate schedule. How will the public react to a double-digit monthly bill increase?
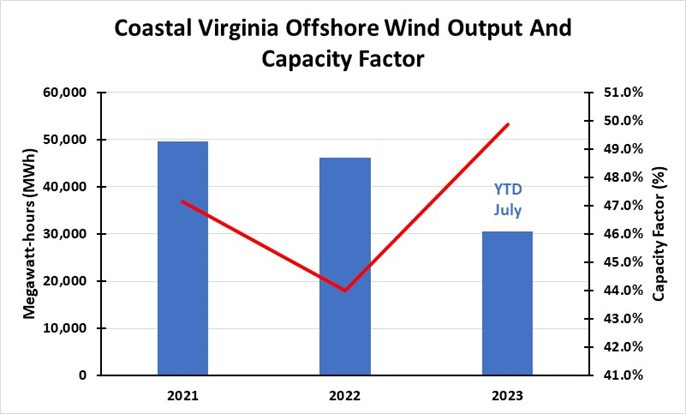
Here is CVOW’s output and capacity factor for 2021, 2022, and year-to-date through July 2023.
CVOW pilot wind turbines are showing good output which holds promise for the $10 billion project under construction.
The next chart shows the monthly output of CVOW and how its performance compares to Block Island Wind Farm’s initial performance target and the performance standard to which the Virginia SCC wanted Dominion Energy to be held. While CVOW has outperformed those performance targets, we note that like Block Island Wind, the output is seasonal. That seasonality is fine for New England which needs wind power during winter months. Virginia has hotter temperatures, so it has a greater air condition load, meaning it needs power during the summer months when offshore wind performs poorly. That will not be good for Dominion Energy and Virginia customers.
CVOW’s seasonal output is low during the summer when the region experiences high air conditioning load and needs more power.
The amount of information about the Bay State Wind bid is somewhat overwhelming, especially when there are pages and pages of totally redacted information. Our curiosity has increased as we have read through the RIE officials’ testimony and have gone through the exhibit. There is much more to know to fully appreciate where this project stands amid the offshore wind industry’s turmoil. The November 6 hearing will be interesting.
(Part 4 will complete our analysis as we work through the possible cost of the project to customers.)


