Energy Musings - October 17, 2024
The Energy Information Administration's Winter Fuels Forecast expects most households to pay a similar bill as last year. That's good news. It really depends on where you live and the weather.
EIA’s Winter Fuels Outlook Offers Interesting Takes On Regions
The U.S. Energy Information Administration (EIA) introduced its 2024-25 Winter Fuels Outlook last week. The agency assessed the upcoming winter’s weather and the supply/demand balance of specific home heating fuels, which when coupled with price forecasts produces an estimate of household heating expenditures. The analysis is performed for four large geographic regions of the country – Northeast, Midwest, South, and West.
The next day, EIA Administrator Joseph F. DeCarolis participated in a New York Energy Forum panel discussing the agency’s forecast. Most of the discussion was a repeat of the prior day’s webinar. However, there was one interesting discussion we will get to later.
What should households expect their heating cost to be this winter?
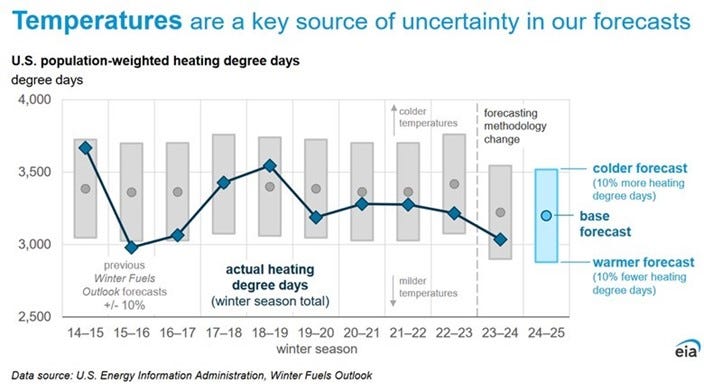
It starts with getting the winter weather forecast right.
The analysis begins with the weather. (We loved the title of this EIA slide.) It acknowledges that if we could accurately forecast the upcoming winter weather, we would get the heating needs prediction right. In other words, like all forecasts, examine the error range.
The EIA expects a 5% nationwide increase in heating degree days. But the increase is not uniform. The Northeast will be 5% higher, while the Midwest is targeted to have 13% more heating degree days. On the other hand, the West should see no increase in heating degree days, and the South is only 2% higher.
These regional differences are important as demonstrated by the following chart. While showing the geographic territory of the four regions, the numbers in the center of the circles give the number of households in each area. The colors outlining each circle show the share of household heating by fuel – natural gas, heating oil, propane, electricity, wood, and other/none.
The South has the most households by a wide margin.
The chart demonstrates the importance of natural gas for home heating in the Northeast, Midwest, and West. However, electricity dominates the South.
Why are these regional differences so important when forecasting regional and national averages? The South has more than twice the number of households than the Northeast, nearly twice as many as the Midwest. It has 83% more households than in the West.
Another example of the importance of regional fuel differences is the forecast for the heating oil market. While nationally heating oil represents 3% of households, in the Northeast it is 55% of homes. The EIA comments that its national heating oil forecast is the Northeast’s.
You will be shocked by the numbers. There are 12,296 households using heating oil in the Northeast. But the remaining regions find minimal use of heating oil: Midwest (197 households); South (454); and West (175). The households in the Midwest and West must be honored to be part of such an exclusive group.
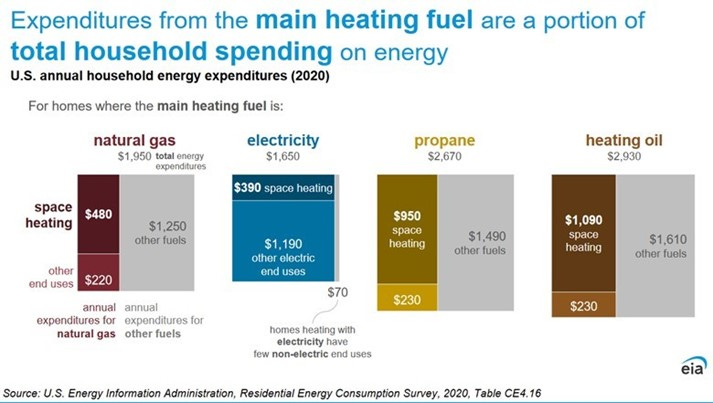
Every five years, the EIA surveys residential energy expenditures. The data is broken down by the four primary heating fuels – natural gas, electricity, propane, and heating oil. The EIA can develop estimates of how much of the annual expenditure on each fuel is for home heating versus its use for other endeavors, primarily for producing hot water. The residents using each fuel also tell the EIA how much they spend on other fuels for household use. The following chart shows the data from the 2020 survey. (When we went to the referenced table, we could not match that data with the numbers in these charts. We sent an inquiry to the EIA but have not heard back.)
Understanding how households spend on energy is key.
The chart shows electricity as the least costly fuel while heating oil is the most expensive. However, if we only consider space heating and other end uses by fuel, electricity is the most expensive and natural gas the cheapest.
These differences exist because of the weather in the respective states and the fuel that dominates home heating. The 2020 Residential Energy Consumption Survey provided the EIA with data for a research brief published in 2023 showing that households in warmer states consume less energy on-site than those in colder states. That is not an earth-shattering conclusion. Warmer weather is an important motivation behind people relocating from colder northern states to warmer southern ones.
The EIA analysis presented two charts. The first shows site energy consumption per household versus average state temperature, including Washington, D.C. The other showed average household energy expenditures versus average state temperatures. There are 15 warmer states versus 36 colder states plus D.C. If one looks at the consumption versus temperature chart and draws a trend line, it slopes downward from the left (Alaska) to the right (Hawaii).
The coldest households use the most energy and spend the most.
The following chart shows the dispersion of average state expenditures around the U.S. average of $1,884 per household for both the colder and warmer states. What is interesting is the much wider spread in cost for the colder states than for the warmer states.
Households in some cold states spend more than others.
The punch line of the EIA winter fuels forecast is that most households will face bills similar to last year. In an era where inflation is a major concern, slightly lower commodity prices and only a 5% increase in heating degree days translates into a potential positive for Americans. But the EIA forecast also highlights the risk of a worse weather outcome in a colder winter, but not much of a gain in a warmer one except for heating oil and propane users.
Winter 2024-25 may be less painful financially.
The EIA chart shows the base case estimates for heating with the various fuels this winter. It also shows the expense of a 10% colder and 10% warmer winter. Heating oil and propane are the most impacted by heating degree swings. Interestingly, in the colder winter case, the cost swing for natural gas is greater than for electricity, meaning a six percentage point increase rather than only four. The narrower change for electricity is because it dominates the heating market in states with naturally warmer temperatures. However, when considering the impact of a warmer winter, the cost swings for natural gas and electricity are similar - a three percentage point change.
Here is what the EIA expects for average expenditures on heating each winter month for the four fuels. It is better to heat with natural gas than either heating oil or propane. Even when you include the higher cost of a colder winter (the gray portion of monthly expense), natural gas is a better outcome than electricity. This analysis leads to questioning whether the push for heat pumps (electric heat) in regions with the availability of natural gas and an advanced distribution system, governments should not be pushing heat pumps.
Natural gas is the winner in this winter’s heating contest.
Let us hope the EIA winter fuel forecast is close to being accurate. Even better, let’s hope for a warmer winter. We doubt this forecast implies higher or lower natural gas, propane, or oil prices.
The EIA forecast produced an interesting discussion point during the New York Energy Forum panel. A speaker noted that the Northeast region (incorporating New England and Mid-Atlantic states) has exhibited zero growth in the number of households over the past five years. There was a 12-household increase out of a 2024 total of 22,472.
Over that period, the number of households using heating oil declined by 20%, while the number heating with electricity increased by a similar percentage. The number of natural gas consumers was unchanged. However, natural gas is the region’s most challenging fuel. It supplies over 55% of the electricity generated in New England. Gas also heats 55% of households in New England.
The challenge during winter is that natural gas is diverted from generating electricity to home heating, forcing power generators to find other, more expensive fuels. Generators are forced to restart oil- and coal-fired generators and to import expensive LNG from abroad. This fuel switch, which can add significantly to electricity ratepayer bills, also increases the risk of blackouts under extreme weather conditions. Bad weather may restrict the resupply of generators using these other fuel sources causing them to have to shut down.
This risk has been noted by ISO-NE, the region’s grid operator, which has been studying how it will be able to decarbonize its 2050 grid while avoiding blackouts and soaring electricity bills. There is no solution physically possible!
Furthermore, as the region decarbonizes its electricity grid by adding heat pumps and electric vehicles, the traditional summer peak in demand shifts to winter. And the winter demand peak will be experienced twice a day! ISO-NE has warned that meeting winter peak demand requires dispatchable power supplies, primarily natural gas. There will only be sufficient gas for electricity generation if most of the region’s heating switches to electricity, which drives up the electricity demand peak.
The New York Forum panelist raised the issue of how long it has been since the Northeast region experienced a bitterly cold winter. He wondered if the system could handle it. The other panelists could agree. We smiled at the question and comments, noting that our summer home heats with oil and has a backup generator supplied with 500 gallons of propane.


