Energy Musings - March 18, 2024
A rotation in the stock market is underway and it signals better times for commodities including energy and materials. This will be a sharp reversal from market drivers of last year. Be prepared.
Inflation, Interest Rates, And Commodities
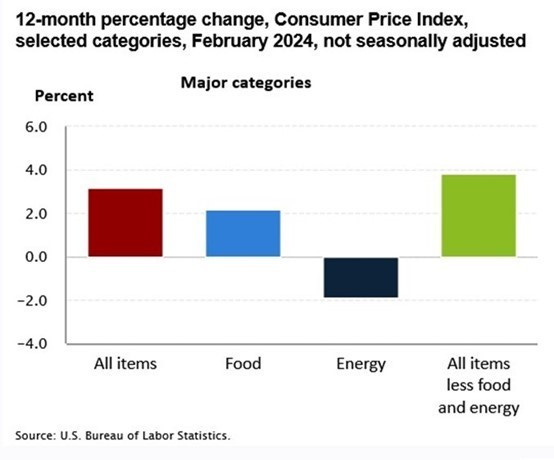
The February Consumer Price Index for All Urban Consumers came in hotter than predicted by economists. For the month, the overall rate rose 0.4% after rising 0.3% in January. Over the last 12 months, the all-items index increased 3.2% before seasonal adjustment. It had only increased by 3.1% in January.
Importantly, the core inflation index, which is the index for all items less food and energy, rose 0.4% just as it did in January. When we look at the core inflation’s annual increase, it rose by 3.8%. The energy index fell 1.9% for the year while the food index increased 2.2%. The volatile food and energy components of the CPI are always excluded to show what is happening to the underlying economy. Energy’s decline helped mask some of the overall inflation. Importantly, for consumers, food and energy are two of their most frequent and often expensive purchases. Therefore, they are very familiar with what it costs them to live weekly. That is why people often disagree with the assessment of Washington politicians who tell them that the economy is doing well.
Like 2023, energy has been helping to tame overall inflation, but that help is likely ending.
More disappointing financial data came a few days later when the Bureau of Labor Statistics released the February Producer Price Index. It showed a 0.6% increase, seasonally adjusted. That was double the January increase of 0.3%, which had increased from December’s 0.1% decline. The monthly pattern suggests that inflation at the producer level is not going down but increasing.
The inflation data observation was supported by the annual data. For the 12 months ending in February, the index for final demand increased 1.6%, the largest 12-month increase since rising 1.8% for the period ending September 2023. Two-thirds of the increase is attributed to goods and one-third to services.
Both the CPI and PPI indices came in above economist estimates. Economists have gotten pretty good at calling monthly and annual government data. While misses usually are measured by tenths of a percentage point, even a one-tenth miss matters to financial markets. For financial markets, it forces a reassessment of assumptions about how the economy is going to do, which is highly dependent on the health and spending of consumers.
For the CPI, economists had been expecting a February increase similar to January’s 0.3%, so actual results were 0.1% higher. Annually, the economists were expecting the CPI to increase by around 3.0%, although they were holding out hold for a number below that threshold. The hotter February rate suggests continued pressure on American consumers.
Here is an example of one important consumer purchase that is experiencing a dramatic turnaround. This chart is of regular gasoline daily prices from the start of November to about a week ago. Notice the reversal that helped mask inflation’s rise.
After having helped to mask inflation, the reversal in gasoline prices is only another sign of why investors should be paying attention to the seachange underway in equities markets.
The financial pressure on consumers is highlighted by data showing consumer debt rising, increased credit card and auto loan delinquencies, and record early withdrawals from individual retirement accounts. The New York Federal Reserve Bank’s fourth quarter 2023 report on credit conditions showed that credit card debt increased by $50 billion to $1.13 trillion.
Wilbert van der Klaauw, economic research advisor at the New York Fed, noted, “Credit card and auto loan transitions into delinquency are still rising above pre-pandemic levels. This signals increased financial stress, especially among younger and lower-income households.” The increases in borrowings also mean that large shares of family incomes are going to service the increased debt.
According to financial fund manager Vanguard, nearly 3.6% of workers participating in employer-sponsored 401(k) plans made a so-called “hardship” withdrawal in 2023. The firm tracks about five million accounts. This rate marks a major increase from the 2.8% withdrawal rate in 2022 and the pre-pandemic average rate of 2%. It is the highest level since Vanguard began tracking the data in 2004. Another sign of financial stress being felt by Americans as inflation continues at a high rate.
The chart below highlights the dilemma economists and financial markets are facing. After declining sharply from the 9% inflation rate in 2022, the decline abruptly ended in June 2023 at 3.0%. Since then, inflation has been going sideways at above 3%. This confirms the existence of “sticky” inflation that Federal Reserve Chairman Jerome Powell has been warning of when pushed by reporters for the timing of when the Fed will start cutting the Federal Funds rate.
The battle to tame inflation seems to have stalled as CPI and PPI data show underlying pricing pressures.
February’s PPI results were surprising and disturbing. Economists had forecast a 0.3% increase, half of the actual results. The high PPI rate may signal that inflation is not cooling as fast as expected, which means interest rates will remain higher for longer, or until inflation rates establish a trajectory toward a much lower level. That is why the prediction of rate cuts starting in May evaporated and is being replaced with a June target date. Even that date may prove optimistic. Economists were heartened by service sector PPI inflation rising by just 0.3% during the month, which was lower than January’s increase. However, the PPI tends to be a more volatile index than the CPI.
With hotter inflation data, interest rates are going to remain where they are – elevated. How long they stay there is unknown, but mid-year seems to be the accepted timing for Federal Reserve rate cuts. The timing is impacted by the Federal Reserve’s desire not to become embroiled in the upcoming presidential election, which officially kicks off following the Republican and Democrat Party conventions in late summer. The continued strong monthly employment reports and healthy GDP estimates are confounding the rate cut timing decision. The Atlanta Federal Reserve Bank’s GDPNow forecast puts the range of Blue Chip economist GDP forecasts between slightly under 1% to 2.6%, with the bank’s model estimating growth at 2.3% for 2024’s first quarter.
Financial observer Bill Bonner recently wrote about the growing risk of a major stock market correction, similar to what happened in 1998-99 with the dot.com stocks. To illustrate the financial pain investors may experience Bonner reviewed what happened to popular stocks that were highly valued for their growth prospects. He noted that Amazon went up 21 times in 1998-1999. When it crashed, the stock lost 92% of its value and needed seven years to get back to its 1999 peak.
As Bonner pointed out, seven years is not a long time in terms of financial markets. During the dot.com boom, investors were highly concentrated in just a few stocks like now. “All of them crashed, and most have still not come back,” he wrote. He said he wasn’t referring to the “flakey dot.coms.” He put Pets.com in that category. (We have a personal story about that stock.)
Bonner also wasn’t pointing to “one-stock tech wonders such as Global Crossing” (another name from the past) as an example of the disappearing company. Rather, he was talking about the “biggest and best companies in the USA.”
Bonner wrote: “Adjusting today’s prices to inflation, we see that only two of the top 10 companies are in the black for the period – 2000-2023 – Microsoft and Walmart. The rest suffered a combined loss of over $1 trillion in market capitalization, in today’s money.” He went on to point out that in 1999, investors buying the leading “can’t-go-wrong” companies had an “80% chance of actually going wrong.” He listed many companies and noted that losses ranged from a low of 12% for ExxonMobil to 100% at Lucent. He wonders what might befall the Magnificent 7 tech stocks, which are the latest “can’t-go-wrong” investments.
We wrote in our March 12, 2024, Energy Musings that there is a rotation underway in the stock market, meaning that investment flows are moving out of technology stocks into other sectors viewed to offer greater return potential. The problem is that we often do not know how much money is exiting the sector, where it will go, and when it impacts the new sector’s performance.
After outstanding performances in 2021 and 2022 for the Energy sector, 2023 was a lousy year. That may be changing. Moreover, the view of energy may be spreading beyond the large international integrated oil companies and large domestic E&P companies. Now we see more interest in oilfield services, refiners, and especially the energy infrastructure companies. Investors may be beginning to recognize that the value of the assets owned and operated by energy infrastructure companies is growing given how governments are making it more difficult to build new projects. Additionally, their balance sheets have de-levered, and free cash flows are growing, meaning increasing distributions. Their current yields are higher than for bonds.
We are not offering investment advice but rather pointing out what is happening in the stock market. The following charts help explain. The first chart shows how investors may be shunning the traditional portfolio construction that calls for investing 60% of the funds in equities and 40% in bonds. This 60/40 balance has a long history of providing stable returns through various market cycles. What we are seeing now is much different.
The chart below shows the performance of three ETFs representing equities (SPY), bonds (TLT), and commodities (DBC). For the 60/40 portfolio, one would focus on the SPY and TLT ETFs’ performance from early 2020. Equities were up 99.35% while bonds were down 37.47%, so a substantial portion of the equities returns would offset the loss from the bonds. However, if one had commodities in place of bonds, the portfolio would have had outstanding performance. Imagine if a portfolio had just some commodity representation how much greater the total return would have been.
The typical 60/40 equities/bonds portfolio would have performed much better had commodities been a part.
The chart demonstrates that investors are focusing on the commodity cycle and its potential duration. Someone may say, wait – the DBC peaked in spring 2022 when the world was recovering from the pandemic, and it has been lower ever since. That is a valid assessment. However, commodity cycles tend to run for years. Therefore, we should be looking at what has been happening more recently.
Here is what has happened to bond yields in light of expectations of multiple Federal Reserve interest rate cuts this year. We just read that the market is giving up on expecting six quarter-point rate cuts and is now focusing on three. Thus, instead of a 1.5% cut in the current Fed Funds rate, we may only be looking at a 0.75% rate cut. Instead of rates dropping from their current 5.25%-5.50% range to 3.75%-4.0%, they may only fall to 4.5%-4.75%. Such an outcome would signal a very different business and financial world.
Bond yields are rising as are crude oil futures prices - driven by fear of higher inflation.
Since late last year, we have seen the yield on the U.S. 10-year bond rise from a low of about 3.8% to its current rate of 4.3%, the highest weekly yield since November. At the same time, we have seen the near-month crude oil futures price rise from below $70 to over $80 a barrel. There are specific factors influencing the oil market that we will get to later.
However, to find out what bond investors are pricing in for inflation, we can look at Treasury Inflation Protected Securities (TIPS) compared to nominal Treasury Notes. Again, we see the highest weekly close in this ratio since November. In the same way, it is not a coincidence that the CRB Commodities Index has also reached its highest levels since October.
TIPS signals investors expect higher inflation which may be spurring the increase in commodity prices.
At the same time, the Nasdaq 100 and the Dow Jones Industrial Average are both sitting at about the same price they were in early February – six weeks ago. The Russell 2000 is where it was last December. Are we experiencing a sea change in the stocks and industry sectors that will dominate market performance? In other words, what worked for investors in 2023 may not work in 2024.
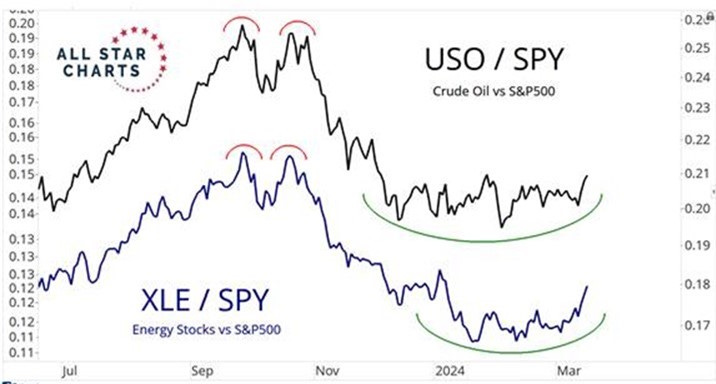
Energy and crude oil are showing a reversal of performance versus stocks.
Why suddenly are commodities and oil performing better? One explanation is expectations are shifting in favor of higher inflation for longer, meaning fewer Federal Reserve interest rate cuts. That means interest rates will remain higher for longer, too. Additionally, the International Energy Agency has revised its estimate of oil consumption growth this year. It now sees demand growing 1.3 million barrels a day, up 100,000 barrels a day from its earlier forecast. Likewise, it sees supply growing less due to the extension of the OPEC+ production cuts until June. Demand and supply growth in 2024 will be less than last year, but the IEA remains less optimistic about the market’s growth than OPEC.
One of the drivers boosting the IEA’s demand forecast is the Houthi attacks on shipping in the Red Sea that have forced most vessels to go around Africa rather than taking the Suez Canal shortcut. Therefore, the IEA sees greater demand for bunker fuel. While the IEA noted the recent attacks by Ukraine on Russia’s refining assets, there has not been any impact on its oil supply forecast.
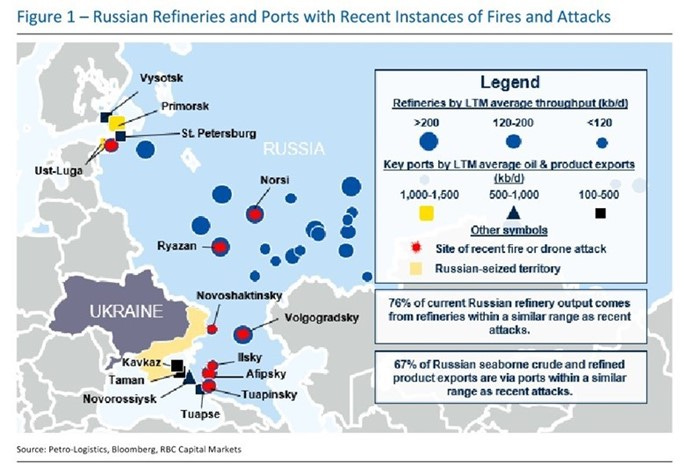
The following map was published by Helima Croft and her team at RBC Capital Markets. Her report notes that Ukraine has struck eight refineries, accounting for 27% of runs in Russia. Three of the refineries have seen significant declines in runs following the attacks. This attack strategy may call into question Russia’s ability to sustain its exports and earn money to fight the war with Ukraine. That is Ukraine’s hope.
Ukraine’s use of drones to attack Russian refineries puts its exports at risk and possibly could drive up oil prices.
According to Croft, Ukraine appears to have the capability to target the majority of western Russia’s export facilities, which would put about 60% of Russia’s crude oil exports at risk. Ukraine had begun attacking Russian oil exports but halted the maritime attacks under pressure from the Biden administration. Such an attack strategy may be adopted by Ukraine if Russia continues its battlefield gains and U.S. aid continues to lag.
While geopolitical risks may appear to be one-time events, the capital spending cycle for oil and commodities is generally tempered by high interest rates. For oil and gas companies, adhering to financial discipline as demanded by investors, they must adjust their capital spending in concert with crude oil price trends. With oil prices having fallen late last year, oil and gas company capital spending plans projected an increase of about 5%. The oil price volatility so far this year, plus the collapse in natural gas prices, has caused many companies to cut their planned spending. U.S. oil output was projected to increase and has so far, but sustaining the growth may be at risk. That could leave OPEC as the only option for additional oil supply, especially if Russian exports are curtailed. More OPEC oil will not come cheap, further pressuring inflation.
The reduced capital spending will ensure less domestic output growth in the future. Occidental Petroleum CEO Vicki Hollub explained the scenario in a recent CNBC interview. “We’re in a situation now where in a couple of years’ time we’re going to be very short on supply,” she said. Her view is founded on the lack of reserve replacement experienced by the industry during the past decade when low oil prices and investor preference for returns of capital pressured industry capital spending.
Is the stock market starting to realize that the oil and commodity cycles are regaining lift after the 2023 lull? This would be a very different stock market than most investors are envisioning and positioned to navigate.


