Energy Musings - June 3, 2024
We examine some of wind energy's primary performance problems seeking solutions that make it less intermittent and potentially a cheaper alternative power source.
Wind Energy Performance Problems – Part 1
Intermittency problems are dismissed by wind advocates who claim that “the wind is always blowing somewhere.” The American Wind Energy Association (AWEA) even has a video extolling the wonders of wind and assuring us that technology has minimized intermittency. AWEA claims “the average turbine generates electricity 90% of the time.” So, with wind turbines spread across 41 states, if the wind isn’t blowing in one place it is surely blowing in another. High-tension transmission lines can move the power from one place to another when needed. The intermittency problem is solved.
According to a study by consultant Wood Mackenzie, to create a U.S. electricity system based on 100% renewable energy, we would need to double the existing 200,000 miles of transmission lines costing $700 billion. The Federal Energy Regulatory Commission (FERC) just proposed a transmission planning mandate for utilities to forecast needs for the next 20 years. Then need to update these plans every five years and determine how to spread the cost across their system and region.
The FERC move comes as the Biden administration realizes it must address expansion and upgrade of the nation’s electricity grid if its clean energy agenda has any chance of succeeding. The FERC move was timed to avoid possible repeal under the Congressional Review Act by the next administration in 2025.
Other studies show how much new and upgraded transmission is needed to handle increased renewable energy. A 2021 Princeton study said $350 billion needed to be spent by 2030. Similarly, a National Renewable Energy Laboratory (NREL) study targeting 100% clean energy says 91,000 miles of new transmission lines must be built. That may be a challenge based on the recent history of transmission line construction. Depending on the definition of a high-tension transmission line, we find problems with the projections. The following chart from Grid Strategies shows the number of miles of 345kv power lines built in 2010-2021 and how they have fallen in recent years.
The low rate of transmission miles added to the grid is a problem for adding more renewable energy capacity.
The chart shows that during the first half of the 2010 decade, the industry installed an average of 1,700 miles a year. During the last half of the decade, the installation rate fell to 645 miles a year on average. Using NREL’s estimate of the miles of power lines needed by 2035, the industry needs over 5-times more per year. The physical and regulatory limits guarantee such a rate is impossible. Studies have shown that major high-tension transmission lines require a decade from the start of planning to the lines are built.
Without upgrading and expanding transmission networks, adding more renewable energy to the grid will become a greater challenge. Moreover, greater renewable penetration in regional grids leads to increased grid instability. That is in addition to the revelation that wind power generation in the U.S. declined last year despite continued capacity installed.
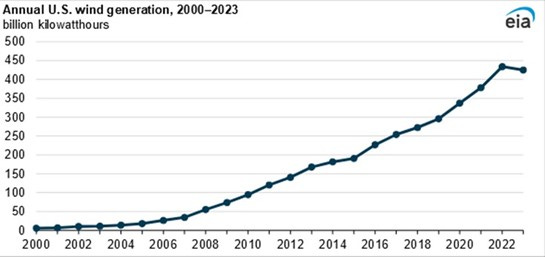
Recently, the United States Energy Information Administration (EIA) published a comment about wind generation in 2023. The EIA produced the following chart showing that 2023 experienced the first national decline in generation (down 2.1% from 2022) since 2000.
Despite adding more capacity, wind generation declined last year.
The generation decline came despite 6.2 gigawatts of new wind capacity added to the grid. The relentless addition of wind generation capacity is shown in the following EIA chart on the left. Other than a nearly flat capacity increase between 2012 and 2013, it has grown yearly since 2010.
Wind’s capacity factor has barely increased since 2011.
What is also illuminating is the average annual capacity factor. The capacity factor is calculated by dividing the actual generation by the theoretical capacity determined by multiplying the design output of each wind turbine by the 8,760 hours in a 365-day year. What we see in the right-hand chart is that the capacity factor has slowly increased from 30% in 2010 to 35.9% in 2022. We also see that the average capacity factor fell in 2014 along with last year.
The key message from the chart is that technology improvements and larger wind turbines, which can harvest more power, have yet to raise the average capacity factor materially. This highlights the wasted capital investment in pursuing 100% renewable energy targets.
To reach 100% output equivalent to the existing 147.5 GW of wind nameplate capacity based on last year’s 33.5% capacity factor, the industry must build two times the existing capacity or an additional 295 GW.
The interesting question is why the 2023 wind generation was down given the additional capacity. There are two possible answers: 1) the U.S. experienced a normal stillness, and 2) the additional capacity installed last year was placed in marginal locations for output.
Explanation 2 has two aspects. First, it is possible that new wind turbines are being placed in areas with lower wind speeds, frequency, and duration. In other words, areas with lower potential wind output than areas where most of the wind development has been focused.
Secondly, harvesting wind energy alters the wind flow (wake) as it passes around and through a wind farm. These disturbances may result in some wind turbines failing to generate as much output as they are theoretically designed to produce. Therefore, a multi-turbine project’s theoretical capacity may never be attained.
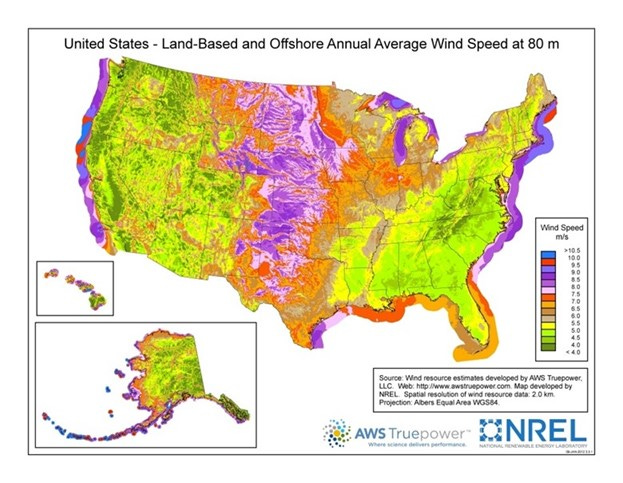
The NREL wind resource map for the United States shows how strong the offshore wind resource is along the East Coast from Maine to South Carolina. Offshore wind is also strong along much of the Pacific Coast, with several powerful wind sections between Northern California and Oregon.
Onshore, as the map shows, the central region of the U.S., extending from the Great Plains to the Gulf Coast, has the strongest winds. Large sections of the rest of the nation have significantly lower wind speeds. There are pockets of moderate winds within these regions. Without knowing where the latest wind farms are located, we cannot determine if they are being put in areas where wind speeds are lower, which could cap their output potential below that of the existing wind industry.
The U.S. has many highly productive wind energy areas, but not everywhere is optimal.
The possibility that stillness caused the reduced output is a more troubling explanation. Meteorologists discovered that wind speeds were slowing starting in 1960. The slowing was not universal. This led to the EU sponsoring a research effort – STILLING – that collected historical wind speed data back to 1880. That provided an additional 80 years of wind data for the study.
A 2021 peer-reviewed paper was published by the European Geosciences Union that examined the issue of slowing wind speeds and their recovery after 2010. The abstract stated: “The observed systematic wind speed decline up to around 2010 (stilling) and its subsequent recovery have therefore attracted much attention. While this sequence of downward and upwards trends and good connections to well-established modes of climate variability suggest that stilling could be a manifestation of multidecadal climate variability…”
The report’s conclusion was tied to the energy sector, which is transitioning to greater wind energy. “Planning of future renewable energy systems must account for forced long-term trends in wind speeds, as well as multi-decadal wind power fluctuation from internal climate variability.” The report’s authors believe that wind projects need better timing of development to capitalize on multi-decade wind trends. They believe further studies of climate variability must be incorporated into the planning for wind development to maximize the effort. We doubt such work is being done in the U.S.
This research addresses the longer cycles of wind speeds. However, we already know that wind has a seasonal pattern.
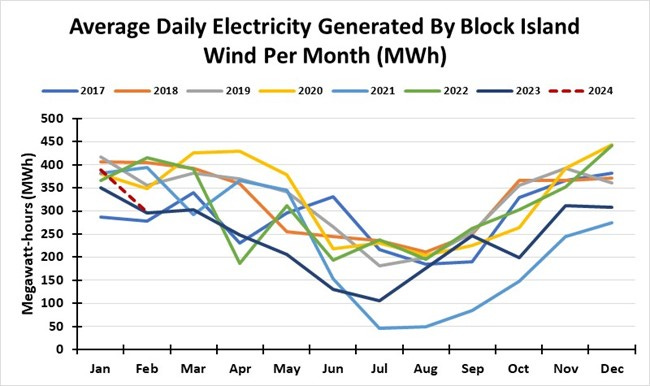
The following chart shows the average monthly daily wind output for the Block Island Wind farm since it began operating in December 2016. We see how offshore wind in New England is stronger during the winter months and sharply reduced during the hotter summer months.
The offshore wind’s seasonal pattern is clear, but every year can show significant variation from the pattern.
Another measure of seasonal variability can be seen in the following chart of the daily wind output in Europe so far this year. The chart shows the amount of onshore and offshore wind power generated daily across the European Union member countries.
Europe exhibits a similar season wind pattern, but with significant daily and weekly variation.
We see how strong wind energy is during the winter months of January and February Still, there are brief periods of stilling compared to the other days. March showed less wind energy, but April seemed to produce more, although less than in January and February. Now, that we are well into May and spring, the wind output has declined sharply.
A final European wind chart shows the total output for November 2022 and 2023. Even with a similar winter month, the variability during November of each year is evident, as well as how wind output varied between the two years. Yes, this variability can be attributed to different weather patterns. However, the output variability highlights the challenge facing utility companies and grid operators in balancing their system loads.
A seasonally strong month can show significant variation in wind output in different years.
In Germany, the periods of low wind and little sunlight are referred to as Dunkelflaute. An International Energy Agency (IEA) analysis shows that five or six times since 1990 the continent has experienced cold weather with little wind. The analysis covered the EU, U.K., Nordic countries, several Balkan countries, and Ukraine. The Dunkelflaute covered large areas of Europe for a week or more, including areas where most onshore and offshore wind turbines are located.
IEA officials acknowledged that this phenomenon must be included in energy planning for the future. Think-tank Agora Energiewende says that modeling of European clean energy mandates projects 96% of the continent’s power will come from renewable energy sources by 2050. The push to electrify everything means electricity could provide 70% of Europe’s final energy demand by 2050, up from 20% today.
European energy planners seek more interconnection cables to solve the stilling problem. But that only works if all the regions are not suffering from stilling, and transmission lines can move available power to areas needing it. Such a scenario highlights the need for long-term energy storage that can be dispatched at rates sufficient to power the grid. Europe is relying on hydrogen to be that savior. Many people are skeptical of this solution because of technical and cost issues.
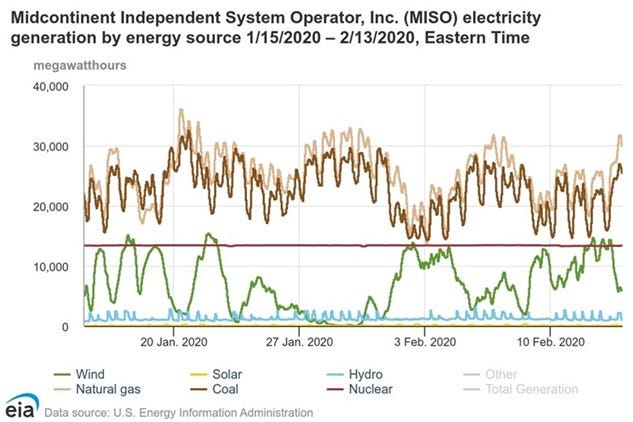
The daily, seasonal, and cyclical variability of wind energy in various regions demonstrates why it needs dispatchable energy as a backup. Batteries are the default position of wind developers and climate activists. However, batteries are not energy sources but rather temporary power supplies. That becomes a problem as we see in the two charts below by energy modelers Isaac Orr and Mitch Rolling of Energy Bad Boys on Substack.
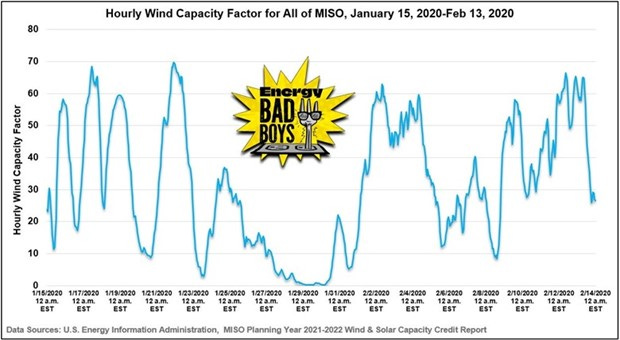
The first chart shows the hourly wind capacity factor for the MISO system from January 15 to February 13, 2000. As the Energy Bad Boys wrote, “…the region experienced an 82-hour wind drought during which all of the installed wind capacity on the 15-state MISO grid—22,040 megawatts (MW)—generated less than 10 percent of its potential output during this timeframe. Of those 82 hours, 42 straight hours saw wind capacity factors below 1.5 percent, which you can see in the graph below.”
Wind can disappear for days, which creates serious problems for grid operators to overcome.
The grid operator responded to the low wind capacity factor by relying on natural gas and coal to make up the energy shortfall. As this chart demonstrates, every time wind output rose to high levels, natural gas and coal output fell. Likewise, when wind output disappeared, natural gas and coal output would reach high levels. This relationship explains why natural gas has become the primary backup source of energy supplies to offset disappearing renewable energy. Few regions have as many operating coal plants to help natural gas generators meet grid demand.
When the wind stills, grids rely on dispatchable energy sources like natural gas and coal.
Wind energy has a role in the energy transition but struggles to be the primary power source. We have identified several of the issues that challenge wind’s dominant role. Wind resources are largely remote from the population centers that need clean power. Building transmission lines will be expensive, disruptive, and take much longer than expected. These power lines will help move surplus power from one geographic region to another, but there is no guarantee it can happen as timely as grids require. Therefore, transmission lines are likely to have a minimal impact on the need for substantial dispatchable backup power sources.
We do not know if the decline in wind output last year was due to installing wind turbines in marginally productive locations or the result of the wind stilling. The wind has a natural seasonal variability that is well-demonstrated. There is long-term cyclical variability that can last for decades. These are critical issues that receive little attention. As more wind power enters service, grids are increasingly at risk of blackouts if insufficient backup power sources are available. All of this translates into higher costs for electricity customers.
(Part 2 will examine other performance issues for wind energy.)


