


Energy Musings - July 17, 2025
The prices of metals, minerals, and interest rates are not aligning with the political and economic narrative of a slowing economy and falling rates. This is not investment advice.

What Are The Metals Telling Us?
Note: Nothing in this article should be taken as investment advice.
Stock markets are forecasting tools. They collect the data and wisdom of investors and massage it into views about the future of individual stocks. Collectively, the universe of stocks produces a vision of where the economy is heading and, therefore, company earnings. Individual company share valuations are based on estimates of their future earnings and the returns they are expected to generate for shareholders. Individual share prices reflect the sum of these estimated future returns.
Stock markets are often emotional. They respond to geopolitical, industry, and company news. Markets are frequently driven by speculation about the future, both optimistic and pessimistic outlooks. These emotional periods can create fortunes and destroy the wealth of investors. They provide the material for major studies of how emotions and data interpretation can propel periods of irrationality. One of the classic market studies is titled Irrational Exuberance.
The two classic studies of market psychology are Charles Mackay's 1841 work, Extraordinary Popular Delusions and the Madness of Crowds, and Charles Kindleberger’s 1978 book, Manias, Panics, and Crashes: A History of Financial Crises. They are interesting reads to understand how markets can go to extremes, and sensible people get swept up.
The stock market in recent years has been driven by the strong earnings of technology companies, especially the “Magnificent 7” – Microsoft, Amazon, Meta, Apple, Alphabet, Nvidia, and Tesla. These seven companies are the most valuable in the market, focusing on secular technology growth trends such as artificial intelligence, cloud computing, online gaming, and cutting-edge hardware and software. For instance, Nvidia’s market capitalization exceeds the cumulative market values of the bottom 100 stocks in the Standard & Poor’s 500 Index.
Buying these shares, or investing in ETFs or mutual funds holding them, has been rewarding for investors. Knowing when to buy them and when to sell them is the challenge. These companies are often equated to the 1960s and 1970s Nifty Fifty stocks. They were a handful of companies whose business prospects were so positive, with steadily rising earnings as far into the future as investors could see, that they were referred to as “one decision stocks.” Investors only had to buy them. Unfortunately, many of these companies are no longer around or have been acquired by others. These highly valued stocks crashed during the 1980s, never to return to their previous glory.
Many investors may recall the next speculative period – the dot.com craze. These were the companies capitalizing on the emergence of the internet and its revolutionary impact on consumers and businesses. Their futures were unlimited, and they became the one-decision stocks of the late 1990s.
As an aside, we were an oilfield service analyst with a New York Wall Street firm during that mania. We followed a dot.com analyst on the podium before our sales force one afternoon. The preceding analyst was following a pet supply company. Its market valuation was based on a measure of the number of “eyeballs” looking at the company’s website, since revenues were negligible and losses, not earnings, were piling up. Salesforce questions centered on the value of an internet click on the website, since many people were not buying, only looking. We recall that we began our presentation by noting that we would discuss companies with real revenues, cash flows, and earnings.
Today, investors remain enamored with technology companies. They seem to care little for other industries, especially those that provide the basic materials and energy that allow technology companies to prosper. The challenge for investors is to determine the appropriate valuations to assign to high-flying technology companies, given the economic uncertainties on the horizon. Likewise, what are the companies that provide help worth in the marketplace?
Investors and economists are concerned that the tariff war, continued geopolitical tensions in the Middle East and Southeast Asia, and the ongoing war in Ukraine, coupled with high interest rates and large government deficits, will slow economic growth and risk recession. Stocks tend not to perform well in the lead-up to recessions.
The current view is that the prospect of a recession is diminishing because central bankers recognize the peril their economies face from rising unemployment and are moving to cut short-term interest rates, while also increasing liquidity to their financial markets. Such a macroeconomic view suggests to stock market strategists that they should be positioning investment accounts to capitalize on lower interest rates and a reacceleration in GDP growth.
The strategy of a 60/40 percent split between equities and bonds in people’s investment portfolios has not been effective over the past several years, as stocks have soared while bonds have failed to generate returns that are acceptable to investors. The strategy of positioning for higher growth and lower interest rates means investing in more rapidly growing sectors, such as technology, as well as in higher-risk assets like small-cap stocks. Bonds are to be held or bought before interest rate cuts drive their prices higher.
But a funny thing is happening in the market. Metal prices are rising, as are the investment vehicles representing them. In some cases, the stocks of companies mining the metals are rising. On the other hand, interest rates do not seem to be falling, although the prospect of cuts to short-term interest rates this fall by the Federal Reserve is growing. That view is driving interest in holding bonds. However, concerns remain among fixed-income investors that growing government deficits may drive up the cost of borrowing, which will counter the expected impact from Federal Reserve interest rate cuts.
The following chart shows the relationship between the 10-year U.S. Treasury yield and the ETF for copper, an essential metal for economic growth, from 2004 to 2025. What you see is the soaring price of copper futures during the economic boom period preceding the Great Financial Crisis of 2008-2009, and you see the futures dip during the 2020 pandemic, followed by a sharp recovery as the world recovered. The 10-year U.S. Treasury yield rose in the early years as the housing market experienced a boom. Rates then began a volatile decline that bottomed in the early months of the post-pandemic recovery, as central banks poured liquidity into the market and slashed interest rates to support people and economies suffering from the economic shutdown. Rates rapidly recovered in step with the economic recovery. Since then, both interest rates and copper prices have trended higher.
Copper and interest rates fail to perform in line with the economic narrative.
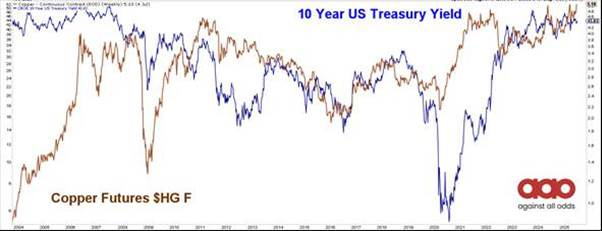
Copper suggests that the economy is growing rather than declining. Some people would say copper prices are up because of President Donald Trump’s tariffs and that customers and suppliers were rushing to build inventories ahead of the tariff’s effective date. Undoubtedly, there is some truth to that argument. However, we note that copper prices climbed steadily through 2024 under the previous administration and through the early months of 2025 before the threat of tariffs.
Interest rates are also remaining higher than forecasters have predicted. Famous investors in fixed-income securities had predicted the end of the 40-year decline in interest rates and the return to more traditional interest rate levels. That suggests interest rates will remain higher than politicians and economists would like them to be to reward capital providers, but not too high to choke off economic growth. Such an outlook differs from that of investment strategists, who suggest that investors buy bonds in anticipation that they will increase in price with lower interest rates.
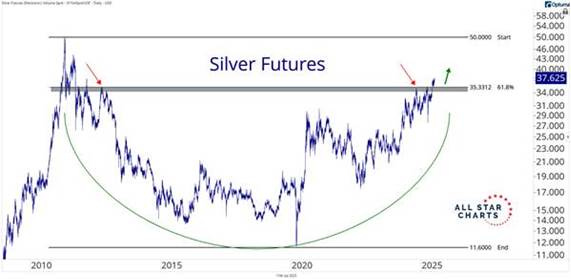
What do we see with other metals? Silver futures prices have been rising since 2024 and have recently broken through a long-standing resistance level established in the early 2010s. That suggests silver’s price will continue rising.
Silver futures are breaking out to higher prices.
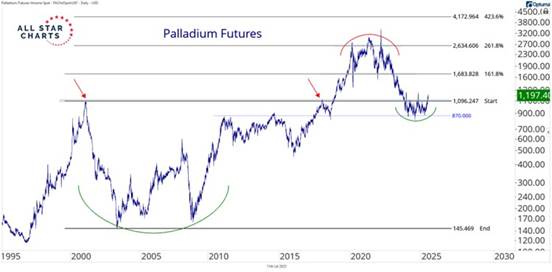
Palladium futures exhibit a bottoming pattern, with an upturn breaking a resistance level established in 2000 and retested in 2017 before breaking through and soaring to record highs in 2020. If they sustain the recent breakthrough, they could easily reach previous highs.
Palladium futures are setting a bottom.
Platinum futures have also broken through a support/resistance level established in 2013-2014. That resistance was briefly broken in 2020, but the economic collapse ended the uptrend.
Have platinum futures broken out?

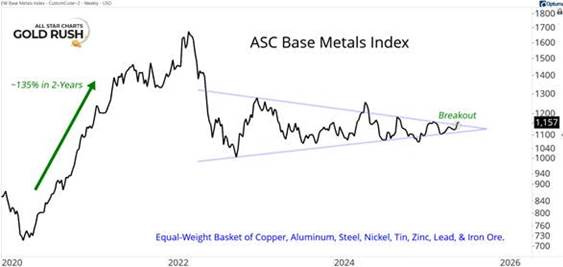
An interesting chart is the ASC Base Metals Index, an equal-weight basket of copper, aluminum, steel, nickel, tin, zinc, lead, and iron ore. These metals are the foundation for economic growth. The chart shows a recent breakout from a triangle pattern, which is formed by the convergence of two lines showing lower highs and higher lows. Once again, this market action appears to contradict the narrative of a global economic slowdown.
Base metal prices breaking out suggest a stronger economy.
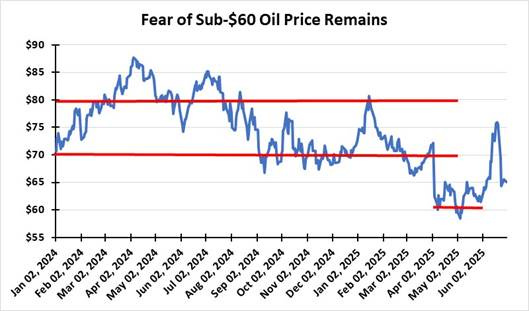
We should add crude oil prices, which soared into the mid-$70s with the outbreak of the Israel-Iran war and the U.S. bombing of Iran’s nuclear facilities. The price spike reflected traders adding a risk premium to oil prices. The risk was Iran’s closure of the Strait of Hormuz, through which passes 20% of the world’s daily oil supply. Despite forecasts of an adequately supplied, and likely soon to be oversupplied market, suggesting lower oil prices, they rose following OPEC+’s decision to add back much more of its idle capacity than was expected. OPEC+ anticipates stronger oil demand, in contrast to the International Energy Agency’s forecast that 2025 will experience the slowest demand growth (+700,000 barrels per day) since 2009, outside of the pandemic period. Oil’s price action suggests someone believes OPEC more than the IEA.
Oil prices confound the forecasts for sub-$60 prices.
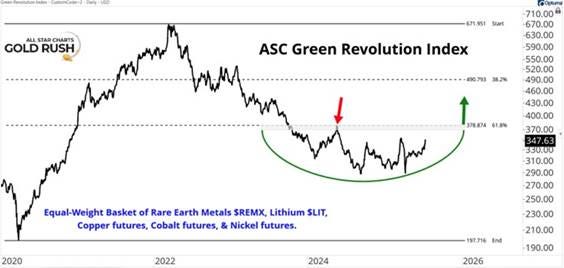
What is also interesting is the price action of an equal-weight basket of critical minerals, including rare earth minerals. Although its bottoming action is not yet complete, the chart indicates that a bottom is forming. The emerging price trend supports the view that these metals may follow all the others higher. Again, rare earth minerals have been in the news recently as the U.S. and China negotiate over access to their output and their key product, magnets. That may be playing a role in the market’s price action, but rare earth minerals are experiencing strong demand.
Rare earth minerals are topical, and prices will likely head higher.
Markets are complex and confusing. Following the day-to-day price movements often renders greater confusion about future price moves. One needs to step back and look at patterns that the price action reveals. The quote, usually attributed to Winston Churchill, “The farther backward you can look the farther forward you can see,” would seem appropriate for stock chart reading. Not all historical patterns repeat, but most do. However, they often reflect different time periods, which may frustrate investors and analysts.
We offer this selection of charts about metal prices because they may suggest a different world unfolding than conventional market wisdom holds. The same goes for interest rates. If these contradictory patterns persist, investors and market strategists who have positioned themselves for a different market outlook will scramble to adapt to the evolving market dynamics. Nobody wants to miss out on the profit potential. That will strengthen the trends and drive prices up. That is also the warning sign astute investors must monitor to understand when trends become manias. Then, early investors should begin plotting their exit strategies.