Energy Musings - February 9, 2024
Charts of interest rates and crude oil prices show how their volatility leads to forecasters making horrendous predictions. The lesson is to focus on uncertainty and how the prediction can fail.
Best To Remember Forecasts And Models Are Always Wrong
A recent issue of the Wall Street Journal contained an article titled “Investors Are Almost Always Wrong About the Fed.” The tagline for the story was “Wall Street clings to hopes for interest-rate cuts despite inflation fears.” The article discussed how lower interest rates provide a boost for the stock market by increasing economic growth through reduced borrowing costs while also limiting competition for stock investing from higher-yielding bonds.
The article’s author pointed out that Wall Street has often been wrong about the direction of interest rates by misreading the intentions of the Federal Reserve which sets short-term interest rates. The purpose of this article is not to discuss the merits of the column but to highlight two of the charts in it. The first showed the history over the past 20 years of the federal funds rate and market expectations (forecasts). The light blue lines (expectations) show how forecasters were wrong in almost every prediction. As interest rates rose in the 2005 period, forecasters expected them to move slightly higher immediately but then flatten out. Those predictions didn’t happen. On the other hand, forecasters expected rates to rebound sharply after they reached a bottom following the 2009 recession. Today, we see many forecasts that call for sharply lower federal funds rates which are proving wrong. Those prediction errors have yet to derail the stock market rally which is rising on the backs of scenarios calling for aggressive rate cuts beginning at some point this year.
Federal funds rate cuts are expected by investors who are pushing up the stock market, but their forecast record is not good.
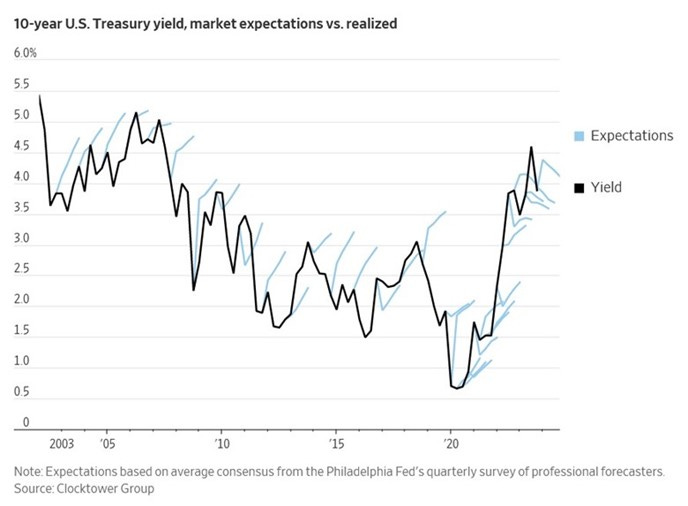
The chart below shows a similar forecast record for long-term interest rates and market expectations. The chart tracks the yield of 10-year U.S. Treasury bonds, which are a bell weather for the cost of borrowing that impacts U.S. economic growth and potentially internationally if foreign bankers tie their lending standards to U.S. rates. As the blue market expectation lines show, the market almost always expected rates to move higher as they were declining during 2002-2020. This is part of the 40-year decline in interest rates that propelled the huge stock market advance.
Now that interest rates are up, almost all expectations call for a future decline in rates. These forecasts reflect the Wall Street sentiment that the Federal Reserve is done hiking short-term rates and needs to cut them quickly to prevent the economy from slowing and stumbling. However, as Howard Marks of Oaktree Capital Management has written to his firm’s clients, the most recent period of zero interest rates was an aberration and not the norm. He believes the 40-year decline in interest rates that we completed in 2020 will not be repeated because rates are not sufficiently high to provide room for another such decline. Thus, he sees money flows becoming insufficient to drive a correspondingly long stock market rally. He believes interest rates will settle within their long-term average of 3.5% to 5%, which will provide bond and asset buyers with reasonable returns and investment opportunities while stock market profits will be minimal.
10-year Treasury bonds reflect the cost of company borrowings so the yield can impact economic growth.
Reading the Wall Street Journal article reminded us of the dictum that all models are wrong, which also means all forecasts are wrong. Having spent a career creating business and industry models and making forecasts, we have always known that immediately after making a prediction it will prove wrong. Unfortunately, we never know which incorrect assumption or surprising dynamic we got wrong and which sabotaged our forecast.
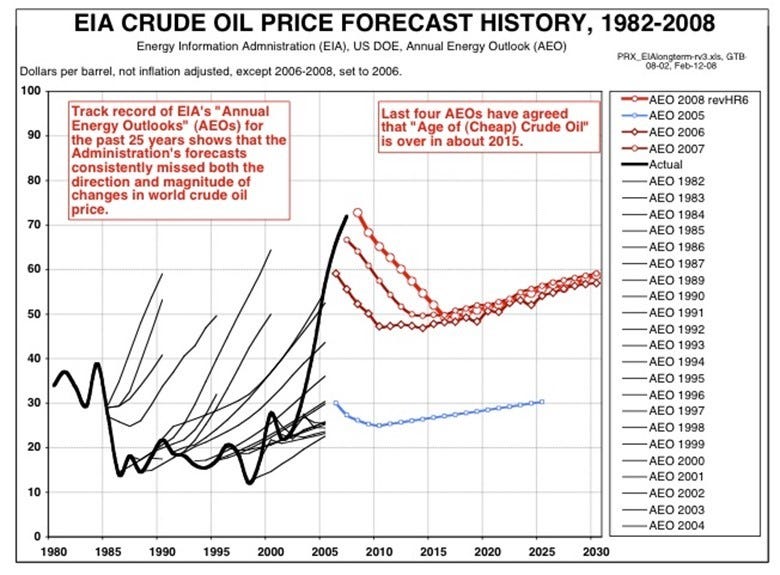
The following chart examines the 1982-2008 history of oil price forecasts made by the Energy Information Administration in its Annual Energy Outlook reports. Much like interest rate forecasts, the EIA got its oil price outlooks wrong almost every time.
To some degree, the EIA was the victim of forecasting accuracy demands. When we started as an investment analyst in the 1970s, HP pocket calculators were not ubiquitous. Therefore, we started preparing company earnings models with paper and pencil. Revisions were rare and resisted because it meant erasing what had been done or starting all over. Thus, our estimates were presented as ranges. If you thought a company was going to earn $0.98 a share, you published a range of $0.95 - $1.05. That saved a lot of erasers.
Today, with personal computers and spreadsheets, we find estimates are calculated to the penny. One of the things that drove us out of the investment analysis business was having arguments with junior analysts over a particular number in a spreadsheet. In almost every case, these financial wizards were arguing over a number they had little understanding of how it was generated. Earnings model accuracy was more important to these analysts than understanding how the industry functioned and how companies earned their income.
EIA is not the only organization or individual who has a poor crude oil forecasting record.
The value of models and forecasts is the discipline they force upon the preparer to understand the reality of assumptions and industry/company dynamics. Computers and spreadsheets produce an accuracy that seldom exists in the real world. These single-point estimates ignore the concept of uncertainty. Focusing on the uncertainty of estimates is beneficial for understanding when and how your projections will disappoint. The above three charts are a lesson in bad forecasting and why devoting more time to understanding uncertainty is more valuable.


