Energy Musings - February 13, 2024
The stock market it tumbling today on a "hot" CPI number for January. The market has been trading on the assumption of perfect economic data to enable multiple interest rate cuts. Not now.
Shifting From Passive To Active Investing
A debate has been ongoing since last fall about the nature of today’s stock market and how investors should manage their investments. In the years immediately before the Great Financial Crisis and the resulting recession of 2008-2010, the U.S. Federal Reserve and other central banks were called upon to raise interest rates to slow the rapid economic growth, and the emergence of inflation, but primarily to squelch speculation in the housing market. The rate hikes successfully derailed the faulty risk/reward pricing in the home mortgage market but with serious damage to the overall economy. A global financial crisis emerged as the financial health of banks and major corporations was tested and many needed governments to bail them out.
As the dust from the financial crisis began to settle, it became evident that economies needed help to get going again. Central banks dropped short-term interest rates rapidly to nearly zero to pump up economic activity. Once the economy improved, the Fed and central banks moved to raise rates toward a neutral rate that would keep economies growing while not igniting inflation. However, economies sputtered with the higher rates so central bankers quickly reversed course and pushed rates down close to zero.
People believed the zero interest rate world was the norm but they are beginning to learn about higher-for-longer interest rates.
The chart above tracks the Euro bank interest rate which mirrored U.S. rates for 2003-2023. From 2016 to 2022, short-term interest rates yielded negative returns for savers. Inflation rates exceeded interest rates. If you had put your money in the bank, you lost the purchasing power of that money despite being paid interest. To secure reasonable earnings traditionally provided by bonds and other debt securities, investors were forced into buying dividend-paying stocks, or even to begin speculating hoping for larger capital gain payoffs to make money.
The following chart shows the S&P 500 Index (light blue) along with the Nasdaq (pink) and the Dow Jones (purple0 for 2002-2024. Except for the pandemic collapse in 2020, the indices showed steady upward trajectories from their recessionary lows in 2009. During this period, the Nasdaq exhibited the most dramatic rise because it is home to the important technology stocks that powered the market higher. Those technology stocks are known as the Magnificent 7 (Alphabet, Amazon, Apple, Meta, Microsoft, Nvidia, and Tesla). They were and continue to be valued at astronomical multiples of future earnings; well above any historical precedent outside of the Nifty 50 stocks in the 1970s and the dot com ones in 1999.
With the commencement of the zero interest rate world, stocks took off with the technology-dominated Nasdaq leading the way.
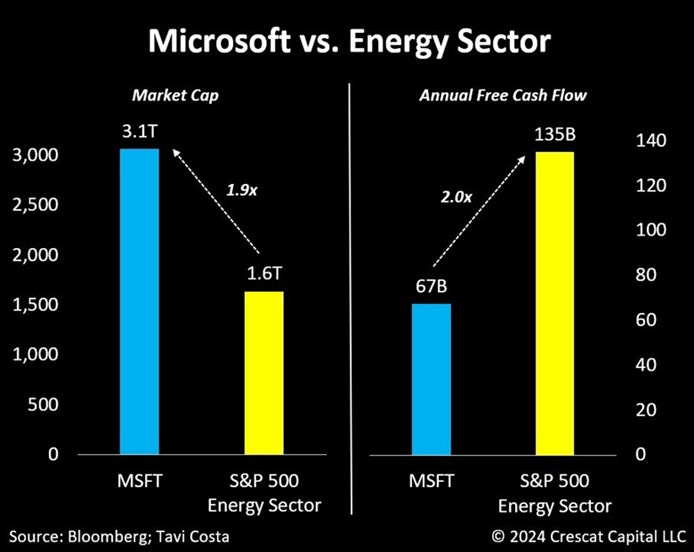
That history is a preface for the following chart comparing one of the Mag 7 stocks – Microsoft – and the Standard & Poor’s 500 Index’s Energy sector. Microsoft has a market capitalization of $3.1 trillion, nearly twice the size of the Energy sector. However, Energy is capable of generating twice the amount of free cash flow of Microsoft. An investment advisor used the chart to highlight how overlooked sectors of the stock market may offer better investments than the popular and highly valued technology stocks, especially the Mag 7 stocks.
Microsoft demonstrates how extremely technology darlings are being valued in the stock market.
John Authers, formerly the chief markets commentator at the Financial Times and now a senior editor for markets and Bloomberg Opinion columnist, wrote about the imbalance in today’s stock market from the dominance of the Mag 7 stocks. The following chart from his article shows the importance of technology stocks within the S&P 500 Index. By showing the relationship of the S&P 500 without the technology stocks to the S&P 500 Technology sector, we see that as the dot com stock bubble grew in 1999, the ratio was at a low. It rose sharply when the dot com stocks collapsed. After that ratio peaked – the market without technology was more valuable. Then technology stocks began to outperform and the rest of the S&P 500 index shrank in importance. That decline accelerated shortly after the 2009-2010 recession. Note that the technology stocks were so dominant as we ended 2023 that the ratio fell below the axis – the lowest point in 25 years.
Technology stocks are even more extremely valued than at the peak of the dot com bubble in 1999.
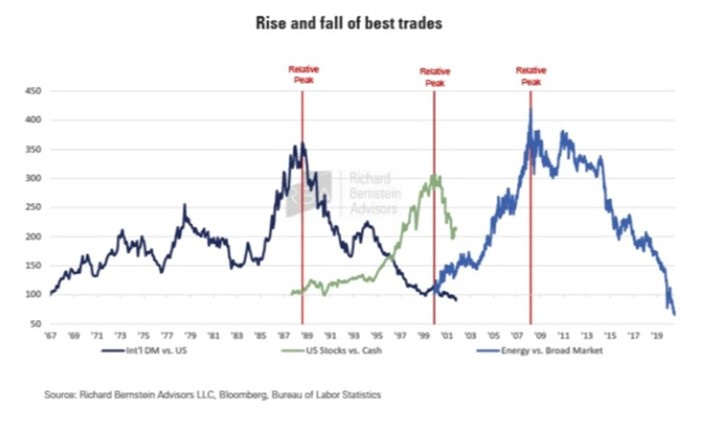
Authers also used a chart from Richard Bernstein of Richard Bernstein Associates showing how previous extremes in market peaks are not repeated. The chart below shows the ratio of international versus U.S. stocks that peaked in 1988; U.S. stocks versus cash, which was the dot com bubble, and peaked in 1999; and energy stocks to the overall market ratio which peaked in 2008. In each case, reaching the peak took years as did the downturn. Authers points out that these market imbalance extremes do not last. His further point was that people should be looking at unloved stock market sectors for investment opportunities rather than continuing to pile into technology stocks, especially the Mag 7 which may quickly become the Lag 7.
Stock market imbalances seldom last, but at the time people believe they will never end.
For most of the low-interest rate era, the easiest way to make money was to put it in index funds that mirrored the broad market, had low investment expense ratios to maximize investment returns, and were weighted to follow the market’s driving force – technology stocks. That was passive management. However, if the stock market is nearing a technology stock peak, rather than riding the inevitable decline down, investors should be seeking stock market sectors that are depressed but offer solid economic outlooks. Energy may be one of those unloved sectors. More importantly, this market transition means investors must embrace more active management. This is just another important change driven by the ending of the zero-interest rate era which will make the future much different from the most recent past.


