


Energy Musings - December 6, 2024
The 2024 hurricane season is over. It was an active year, but not quite as scary as some predictions suggested. We examine the season, some of its records, and the CSU forecast assessment.

Active But Scarily So?
November 30 marked the end of the 2024 Atlantic basin tropical storm—yes, hurricane—season, which starts on June 1. Eighteen tropical cyclones formed, and all of them became named storms. Eleven storms evolved into hurricanes, and five strengthened into major hurricanes. A potential tropical cyclone that was designated did not develop into a tropical cyclone. Of the 18 tropical cyclones, 12 made landfall. It was an active storm season, as predicted by all the forecasters who are now in the game of predicting storm activity.
As forecasts were beginning to be revealed, there was concern about how bad the upcoming hurricane season would be. The leading forecaster, the National Oceanic and Atmospheric Administration (NOAA), predicted 17-25 named storms (winds of 39 miles per hour or higher), with 8-13 becoming hurricanes (winds of 74 mph or higher), including 4-7 major hurricanes (category 3, 4, or 5; with winds of 111 mph or higher). NOAA said it had 70% confidence in its forecast ranges.
"This season is looking to be an extraordinary one in a number of ways," NOAA Administrator Rick Spinrad said during a press conference. He was referring to the very warm sea surface temperatures and the expectation that the El Niño weather pattern would transition into La Niña by summer or fall.
AccuWeather meteorologists warned in February of an "explosive" upcoming hurricane season. Based on its forecast, the weather organization warned that some regions of the United States were at a higher risk. This was not the only storm forecaster warning of large numbers of storms.
University of Pennsylvania Earth and Environmental Sciences professor Dr. Michael Mann, famous for the hockey stick CO2 and warming graph that has powered climate change activists, along with his fellow scientist Shannon Christiansen and the program’s alumnus Dr. Michael Kozar, issued their prediction for the hurricane season last April. Their prediction called for 27-39 named storms, with their best estimate being 33 storms. The forecast proved off the scale.
One of the most rigorous hurricane forecasting outfits is the Tropical Meteorology Project at the Colorado State University’s Department of Atmospheric Science (CSU). This effort evolved from the groundbreaking tropical cyclone work of the late Professor William M. Gray. He began forecasting upcoming hurricane activity in 1984. His work discovered that multiple factors needed to be included in the models to forecast storms. This has resulted in the team developing multiple forecasting models based on different factors at different times of the year. The models are re-evaluated each year for their forecasting accuracy, along with an overall assessment of the prediction.
The CSU forecast predicted 23 named storms in 2024, with 11 hurricanes and five major hurricanes. Their hurricane number was the highest CSU meteorologists predicted in their 41-year history of publishing initial outlooks in April. Behind the high number of storms and hurricanes predicted was the assessment of the CSU meteorologists that graduate research assistant Nick Mesa summed up in comments to Newsweek magazine. "The combination of record warm temperatures and the transition to La Niña during peak hurricane season provides a very conducive environment for storms to develop and intensify that we haven't really seen before," Mesa said.
The chart below shows that because of the active start to the season, CSU increased its named storm prediction to 25 in July but backed off the increase in its August forecast. The reduction reflected the unusual pause in tropical storm activity at the season’s peak for nearly a month. The chart shows each of the CSU forecasts, the actual counts, and the rankings of the seasonal factors compared to history.
CSU produced a fairly accurate 2024 hurricane forecast.
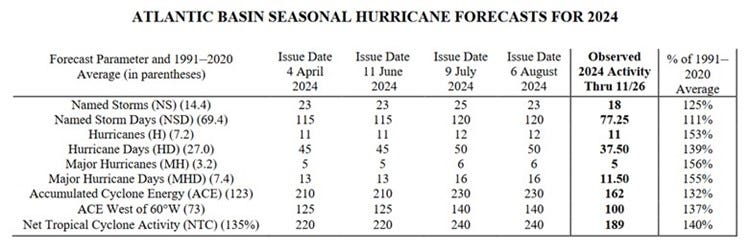
Based on the observed storm activity, 2024’s hurricane season was very active when measured against the averages for the 30 years of 1991-2020. NOAA uses the Accumulated Cyclone Energy (ACE) measure to evaluate a hurricane season’s activity level. This year’s 162 ACE, 132% above the historical average, establishes that the 2024 hurricane season was an “extremely active” or “hyperactive” season based on NOAA’s ACE definition of greater than a 159.6 ACE reading.
CSU evaluated its storm forecast. “Named storm days were slightly above their long-term average, while all other metrics were well above their long-term averages.” They stated: “Our April and June seasonal forecasts performed best for all metrics. The slight increase in overall activity that we predicted with our July and August updates did not verify. We characterize our forecasts for 2024 as a modest over-forecast of overall activity.” Because CSU evaluates each of its seasonal forecasts independently, it can study when the variables employed in each prediction failed, allowing it to work on improving its future projections.
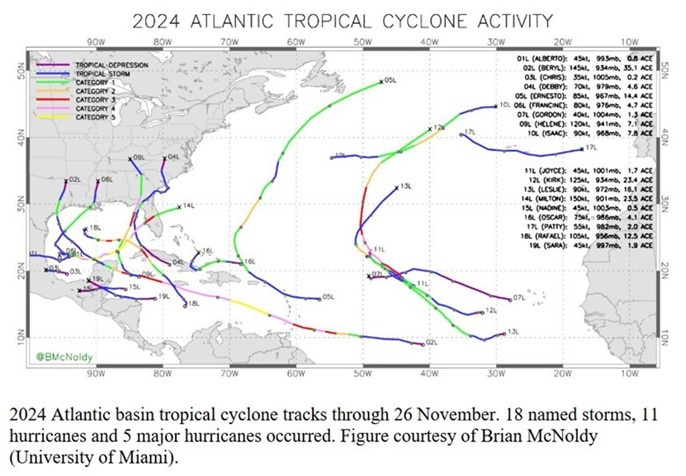
The seasonal forecast review by CSU includes the following chart of each tropical storm’s historical track through the Atlantic basin. The tracks are color-coded to allow the reader to see when the storm reached certain category levels during its life, in addition to following the storm’s path.
Tracking the paths of 2024 tropical storms.
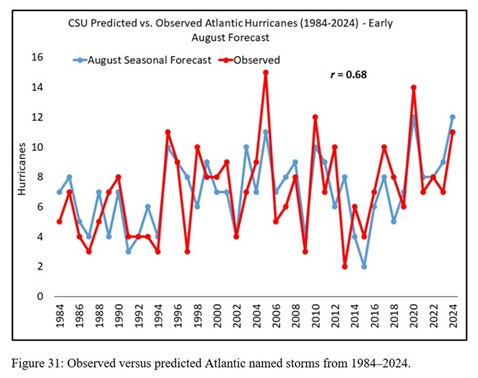
Forecasters should evaluate the performance of their predictions and look at what made the season unique historically. In its evaluation, CSU presented a chart comparing the performance of its August forecasts against actual results since it began issuing forecasts in 1984. A correlation coefficient (r) of 0.68 suggests that CSU’s August model has an excellent predictive record.
Evaluating the accuracy of CSU’s hurricane forecast record.
In tracking the uniqueness of this hurricane season, CSU posted several data points provided by NOAA as it prepares its seasonal wrap-up. These are just a few of the points made by NOAA.
1. The first system, Tropical Storm Alberto, developed on June 19, making it the latest first named storm since 2014.
2. The season’s first hurricane was Beryl, which became the earliest Category 5 storm on record.
3. Eleven hurricanes formed in the Atlantic. The 2024 season tied with 1995 for 5th place for the most hurricanes produced in the satellite era (1966 onwards).
4. Five major hurricanes formed in the Atlantic. The 2024 season tied with 1995, 1999, 2008, and 2010 for 6th place for major hurricanes produced in the satellite era (1966 onwards).
5. Five hurricanes made landfall in the continental U.S. (Beryl, Debby, Francine, Helene, and Milton). The 2024 season tied with 1893, 2004, and 2005 for the second-most continental U.S. hurricane landfalls in a season. Six continental U.S. hurricane landfalls occurred in 1886, 1985, and 2020.
6. Seven storms formed after September 25, the most on record for that time period.
One of the most unique aspects of the 2024 hurricane season was the lull experienced during what is traditionally the height of activity, usually around September 10. National Hurricane Center spokesperson Erica Grow Cei told Newsweek, "We certainly weren't expecting the climatological peak of the season would be a time in which zero tropical storms formed. It's called the peak of the season for a reason."
Grow Cei noted, "We went about a month from mid-to-late August to mid-to-late September without a single storm forming in the Atlantic basin." The storm lull was attributed to the West African monsoon, which helps form the storms, shifting too far north to contribute to tropical storm formation. In addition, Saharan dust contributed to the lull.
We have followed CSU for years – back when Bill Gray was still running the forecasts. We continued to follow his work at the Tropical Meteorology Project and his study of climate change science. He took a stance against the idea that anthropogenic global warming was driving climate change. Gray did not deny global warming but argued that humans were responsible for a tiny portion of it. In his opinion, global warming was more due to the Earth’s natural cycle and not the CO2 emitted by humans.
He worried about the groupthink promoted by politicians and environmentalists seeking greater power in world governance. Gray said that scientists fell into this groupthink because they feared losing grant funding, professional stature through becoming published, and potentially academic tenure. In 2011, Gray authored a paper criticizing the American Meteorological Society for its embrace of anthropogenic global warming, which led to noted scientist members leaving the organization. As a scientist who had developed new scientific understandings of tropical storms and their relationship to climate, Gray was disappointed and frustrated by the attitude of the leaders of his society.
While Gray was writing about climate change groupthink, the public became aware of Climategate after a server at the Climatic Research Unit of the University of East Anglia was hacked, and emails were taken showing bias in managing access to scientific journals for publishing research papers. The bias prevented the publication of research critical of climate change science. While apologists pointed to the university investigations of the hacking and claims of bias, upon examination, they were undertaken to support groupthink. From various emails, we learned of the statistical technique Michael Mann used to create his questionable hockey stick graph and how that technique was used to skew other research.
In another post, we will examine Roger Pielke, Jr.'s recent article showing that the latest hurricane season data is being used to justify misinformation about what the Intergovernmental Panel on Climate Change (IPCC) says about the linkage of global warming and increased hurricane activity. When an IPCC author mischaracterizes the conclusion, one wonders about why.