


Energy Musings - December 1, 2024
Energy stocks performed well in November, helping the sector to close the gap with the S&P 500 Index. The performance came without help from oil prices and charts suggest a change is underway.

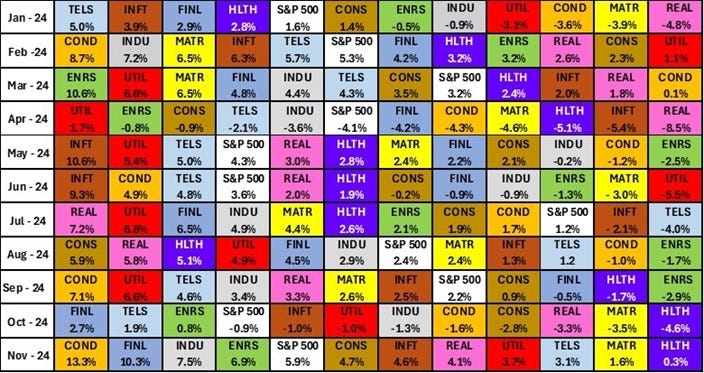
Energy’s Second Month Beating The S&P 500
Energy posted another positive month, beating the S&P 500 Index for the second consecutive month and rising in the sector standings for November and year-to-date gains. For November, Energy posted a 6.9% gain, besting the S&P by a percentage point. This performance earned Energy the #4 ranking among the sectors for the month, down from third place last month.
November was another good month for Energy.
Oil prices did not aid the November performance. This was unusual since commodity-related sectors usually see their commodity’s prices rise ahead of improving company stock performance, but more on that later.
The last time Energy posted two positive consecutive months was in March and April when the sector was still a market darling. That aura disappeared shortly afterward when oil prices began retreating as Chinese oil demand lagged. The OPEC+ surplus oil being held off the market to support prices started weighing on future oil prices. Traders started betting that OPEC+ members would add the surplus crude back to the market as they sought increased revenues from their oil sales.
Based on its year-to-date stock market performance, Energy is in eighth place out of 11, having moved from 10th place in October and last place in September. To appreciate how badly Energy did through the first nine months of 2024, it was not only in last place but also trailed the S&P 500 by nearly 14 percentage points and the leading sector, Utilities, by almost 22 percentage points. The two positive monthly results have enabled Energy to cut the S&P 500 lead by two percentage points.
Oil prices fell below their long-term support level of $72 a barrel this year. The year started on a positive note. The market expected China’s oil demand to finally begin climbing after it was entirely out from under the national pandemic lockdown. That missing demand forced OPEC+ oil producers to remove surplus supply to prevent oil prices from crashing due to the oversupply. U.S. oil output continued to defy expectations that reduced drilling activity would cause supply to fall. All eyes were focused on China as it ended its New Year’s celebration on February 10. However, the real estate market was weak, and the Chinese economy struggled with the debt load and weakness in its banking sector. The prospect that Chinese oil demand would not rebound as expected caused oil traders to abandon their bullish views about oil supply/demand and switch to a bearish outlook for oil prices.
Oil prices in 2024 show how optimism shifted to pessimism.
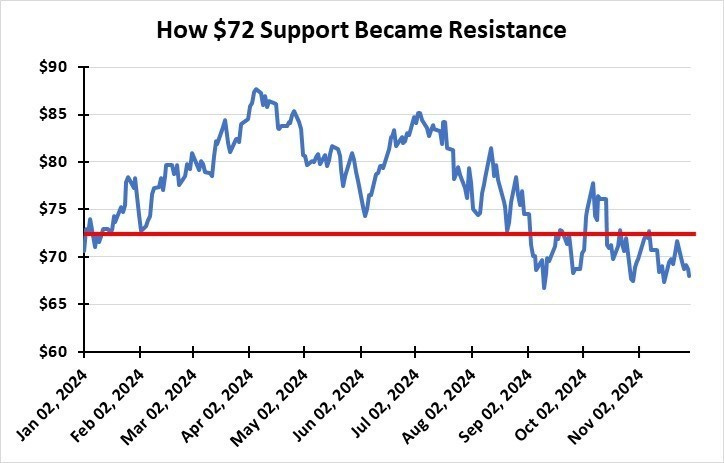
As the chart shows, once the bullish outlook evaporated in the spring, oil prices were steadily downward (with periodic rallies driven by geopolitical events) until early September. Since then, oil prices have traded sideways but have had difficulty breaking above the $72 resistance level and remaining there. The oil price volatility resulted from Middle East political and military events.
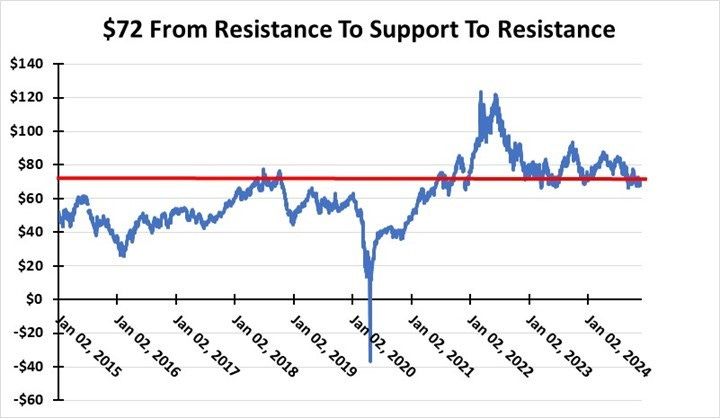
The following chart shows how the $72 price went from a resistance level to a support level and now back to a resistance level. This long-term chart demonstrates the significance of price support/resistance levels. These long-term price trends can be briefly violated for brief periods but require a meaningful sentiment change to make a sustained switch between support and resistance.
The long-term $72 price went from resistance to support.
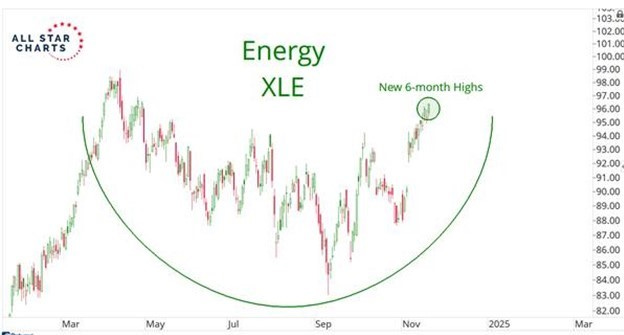
Earlier, we mentioned the energy performance. Three charts from JC Parets of All Star Charts show some interesting trends. Ten days ago, he presented the following chart showing the Energy ETF reaching new six-month highs.
Energy stocks are hitting new 6-month highs.
More importantly, he showed that the six-month energy stock market high came while crude oil prices were nearing their lows. As we pointed out above, commodity prices usually move ahead of the stock prices of the companies in the industry. The logic is that higher commodity prices will boost the revenue and profits of the participating companies. That means their earnings per share results will rise and likely beat the predictions of the Wall Street analysts. Better earnings lead to upwardly revised future earnings projections. Rising earnings attracts investors, and they bid up the share prices.
Energy stocks are up, while crude oil prices are down.
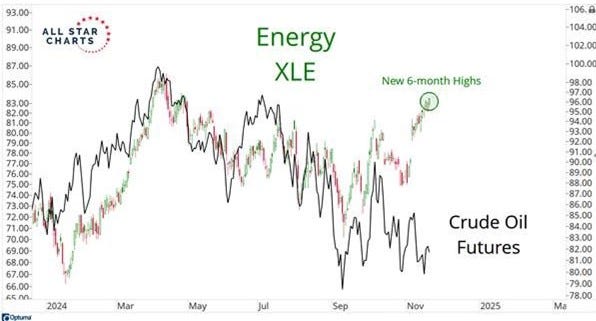
This pattern of commodity prices leading energy stock prices is not happening this time. Is it a market mistake? Possibly.
However, Parets presented a third chart of particular interest. It shows energy stock prices over the years. He made the point that current prices are where they were in 2008. Note that this was just before the Great Financial Crisis. The next time energy stocks reached this level was in 2014, when Saudi Arabia pulled the rug from under oil prices and sent the industry into a significant recession. That recession drove many weak companies into mergers or out of business. Investors, tired of poor financial results from managements focused solely on growth through drilling and not profitable activities, punished the companies and demanded managers embrace “financial discipline” if they were to get the capital needed to grow. At the same time, climate activists pressured financial institutions to choke off loans to oil and gas companies, making it even more difficult for low-profit companies to grow.
Financial discipline brought improved returns on capital, restricted investments, stock buybacks, and increased dividends. Investors were rewarded for providing their capital to proven industry stewards, and stock prices began improving.
Are energy stocks poised for a huge upward price move?
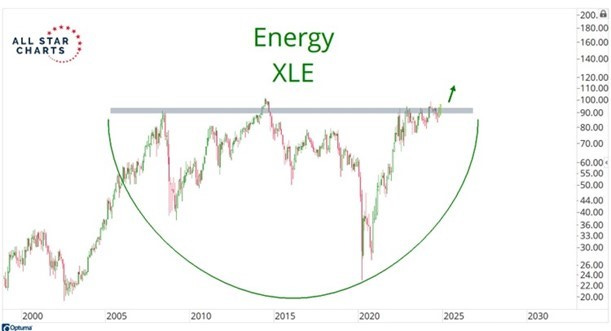
In response to the above chart, Parets noted that he was taught by famous stock technical analysts that “the longer the base, the higher the space.” He believes energy stocks are poised for an extended bull market. But don’t crude oil have to do better? Yes. What will make it happen?
First, we have to have increased global growth. Lower interest rates are likely to help. The pushback against climate policies will mean increased use of hydrocarbon energy, including crude oil and natural gas. A colder winter start has drained Europe’s gas storage at the fastest rate in a decade. European gas prices are up as buyers are luring LNG cargoes heading to Asia to switch to Europe for higher profits.
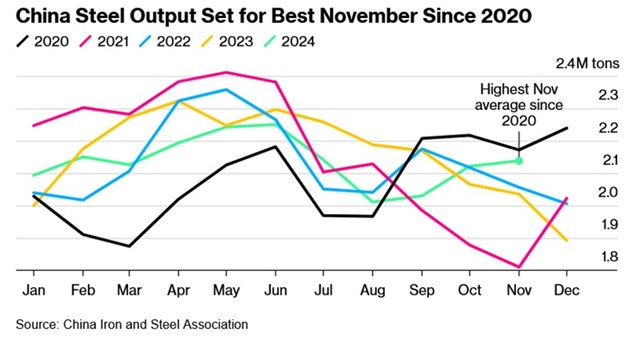
China has embarked on massive financial stimulus to boost its economy. The following chart on Chinese steel may be a preview of the economy's recovery. November's steel output was the best November since 2020, before the pandemic.
Is China’s steel output signaling an energy demand upturn?
Things sometimes move in a different line, so be prepared for disappointments and periods when nothing seems to happen as expected. However, oil and gas are depleting resources that require a certain activity level to keep the supply going. That activity is barely keeping the supply up. The current oil surplus could easily be erased faster than many people anticipate. The stock market charts suggest a change in Energy is underway. Two months of better performance is one indication. China’s steel output may be another hint. We will be closely watching for other clues.