Energy Musings - August 19, 2024
The second anniversary of the IRA provided an opportunity for Democrats to trumpet its success. The media was helpful. Missing was an analysis of the true cost of the legislation.
The Irony And Cost Of The IRA
Gillian Tett, a columnist and member of the editorial board for the Financial Times, wrote about “The red state surprise about America’s green transition.” The was to column discusses the progress and irony of the Inflation Reduction Act (IRA) on its second anniversary last week. She calls the IRA the “most dramatic single policy move seen to date in the west to accelerate a green transition.” The law began as the Build Back Better Act and is designed to foster the development of renewable energy and decarbonization technologies.
John Podesta, the White House advisor who inherited the climate policy role from special climate envoy John Kerry, pointed out that almost 60% of the jobs created by the IRA have gone to districts where Republican representatives voted against the bill. The point was made as Former President Donald Trump talked about repealing the act and 18 House Republicans wrote to House Speaker Mike Johnson arguing against repeal. Furthermore, a Financial Times analysis of the IRA and the Chips Act (to boost computer chip manufacturing) showed that some 80% of the investments were made in red states.
Tett wanted to understand why this investment skew happened. She talked with Heather Boushey, a White House economic advisor, who told her it was wise economic planning. By that, she meant that the bill was designed to encourage investment in deprived areas, such as the Republican-leaning rustbelt states. Amazingly, the Democrats were prepared to dump money into the country’s fly-over states where all the “deplorables” live. Or is it possible their missile missed its target?
Another explanation is that it is the red states that embraced the incentives and possessed the necessary ingredients to make things happen and happen fast. Not only did these states have the necessary raw materials, workers, and infrastructure, but their laws regulating construction permitting and employment enabled projects to move much faster than in most blue states.
The FT map of the announced IRA and Chips projects of at least $100 million that its reporters tracked shows a heavy concentration in the eastern half of the country, especially in the Southeast and Midwest.
FT study of IRA and Chips investments shows 80% of the projects are in red states.
Is the irony that the projects are landing in red states, or that the Democrat politicians who were happy to spend the nation’s wealth, much of which is being paid by the blue state residents, failed to realize their blue state economies would not be major beneficiaries of the legislation? Interestingly, many of the red states with these projects are also where the people moving out of the blue states are heading.
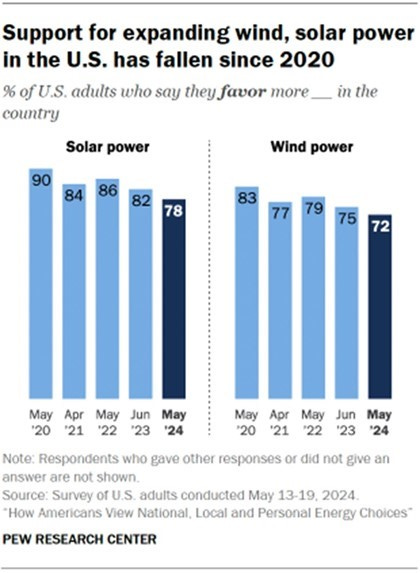
Tett also wanted to make the success of the IRA about the desire of Americans for renewable energy and more climate-friendly policies. She quoted a Pew Research Center survey showing that 78% and 72% of voters want more solar and wind. She acknowledged that the support is down from 90% and 83% in 2020. The chart from the Pew report is interesting since it shows support for these renewable energy sources peaked in 2020 and has declined ever since.
Support for the green revolution is falling suggesting people are realizing its cost and ineffectiveness.
What is even more interesting is that we researched past Pew surveys and found that in 2016 the support for solar and wind was essentially the same as shown in 2020. That suggests that the recent decline in popular support for solar and wind is more significant because it likely means people have learned about environmental issues with the projects and their impact on electricity bills.
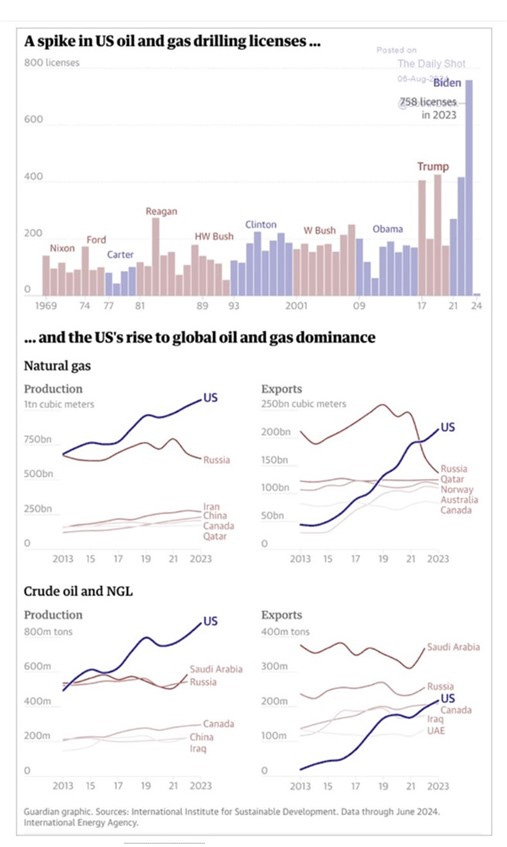
Another irony Tett cited was that the Biden administration approved “758 drilling licenses” last year, twice the rate of the Trump administration. Her source was Columbia University professor Adam Tooze. The chart supporting the conclusion is below. It cites The Daily Shot as the source. The chart is behind a paywall so we could not access it or the data. What we noted is that at the bottom of the chart, it lists the International Institute for Sustainable Development and the International Energy Agency. We cannot find the license data on either organization’s website.
Drilling license data quoted by Tooze and Tett cannot be verified.
What is strange, but not surprising given that Tett works for a British publication, is the use of the terminology drilling licenses. In Europe and other international areas licenses are the arrangements petroleum companies enter into with governments. In the U.S., oil and gas companies secure leases (acreage) and drilling permits (authorizations for drilling) on federal lands.
When we checked the Bureau of Land Management website, we found different data than contained in The Daily Shot chart. Looking at the data on leases granted on federal land, we observed a steady decline in the number awarded. The respective fiscal year (FY: Oct. 1 to Sept.30) totals were: 1,841; 899; 407; 120; and 144. As can be seen, those numbers come nowhere close to the numbers in the data Tooze showed and Tett cited.
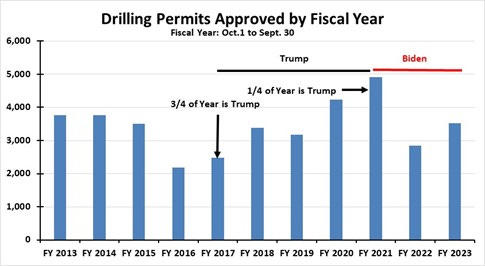
Turning to drilling permits approved by the federal government, we see a different data set. We plotted the number of drilling permits approved by fiscal year for FY13 to FY23. What we see is the second term of Barack Obama’s presidency FY13-FY16, there was a declining approval rate. The approval rate bottomed in the first year of the Trump presidency and was higher in subsequent years.
Our analysis of drilling permits shows Biden benefited early from the Trump policies but then throttled them back.
Because of the fiscal year reporting period, three-quarters of the drilling permits approved in FY17 and one-quarter of those in FY21 should be attributed to the total permits approved under the Trump administration. The high number of approved drilling permits in the first year of the Biden administration reflected the revised approval process introduced during the Trump administration.
An article in Yahoo Finance remarked about how shocked Democrats were when 2022 rolled around and they discovered that officials had been approving drilling permits in the backlog when Trump left office at a 98% rate. That was up from the Trump 94% approval rate. The article stated:
“The reason for the fast pace of approvals is that the BLM streamlined the permit application process under Trump. Between May 2016 and June 2019, permit application review times dropped from an average of 196 days to 94 days, according to the Government Accountability Office.”
With a running start, the Biden administration approved more drilling permits than the Trump administration. Once that was realized, the pace of federal drilling permits slowed in FY22, compared with FY21. The Biden administration has erected barriers to oil and gas leasing on federal lands and the issuance of drilling permits. They have relied on the Bureau of Land Management having to consider climate change implications of approvals, as well as official and unofficial pauses in granting leases and drilling permits, to slow the approval process.
Since we do not know the nature and orientation of the data in the chart posted by Tooze and referenced by Tett, we can’t comment on its accuracy. What we do know is that the U.S. government data reaches a different conclusion. Therefore, we are hard-pressed to accept Tett and Tooze’s idea of irony.
However, there is an irony in that the Biden administration is now presiding over record U.S. oil production. This has been achieved because oil prices have risen to levels assuring healthy profits just as drilling, completion, and production technology have enabled improved recovery rates from wells. Furthermore, the industry has been achieving this record output primarily from private lands.
Tett ends her column praying for the continuance of the IRA regardless of the November election winner. She referenced a new McKinsey study about the energy transition and that it concludes we have only achieved 10% of what needs to be done by 2050 to achieve net zero emissions.
Notably, neither Tett nor Podesta mentions what the energy subsidies are costing Americans in this quest to go green. At the time the IRA was passed, the Congressional Budget Office estimated the cost of the subsidies over the next ten years would be $369 billion. That estimate was later revised upwards when specifics for eligibility standards for certain products were more clearly defined. Independent analyses by the Joint Tax Committee and investment bank Goldman Sachs have the IRA costing between $515 billion and $1.2 trillion. The higher number came from a more liberal estimate of the penetration of electric vehicles into the U.S. fleet.
A killer subsidy estimate came from energy consultant Wood Mackenzie. They examined not only the electric vehicle issue but also the renewable energy sector. They determined that renewable energy subsidies would not end after 10 years but could extend to 2040, 2050, or even beyond. Wood Mackenzie estimates the total cost of the IRA could be $2.5-$3.0 trillion. Under certain circumstances, the cost could rise to $4.0 trillion.
The problem is the renewable energy subsidies. They are scheduled to end once greenhouse gas emissions in the power sector fall to or below 25% of the 2022 emissions level. By not choosing an earlier year with substantially greater emissions, such as a year in the 2000s, the creators of the IRA have ensured power subsidies will last for a long time.
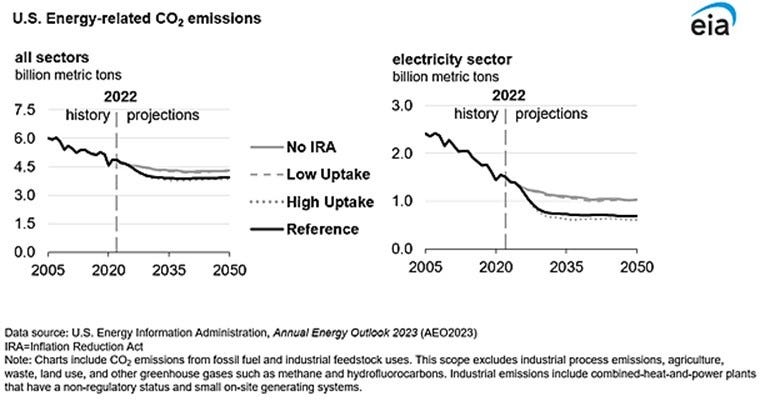
The EIA electricity carbon emissions reduction study says with or without the IRA they will not fall below 25% below 2022’s level ensuring subsidies will be paid until and after 2050.
The Energy Information Administration analyzed the electricity sector’s emissions reduction under a scenario with the IRA subsidies in place and another without them. In neither case was the U.S. power sector able to reduce its 2022 emissions by 75% or more before 2050. Twenty-six years of power subsidies is what blows up the IRA cost. The chart below shows Wood Mackenzie’s annual and cumulative subsidy projections by category.
Wood Mackenzie estimates that the IRA subsidies will cost $2.5 to $3.0 trillion, and possibly up to $4.0 trillion.
Two observations of note. First, the IRA will be paying subsidies until 2060! Second, the lion’s share of the annual subsidies will be paid to solar. In fact, in 2049, when the annual subsidy outlay peaks at roughly $100 billion, solar accounts for nearly half the total. That is a lot of money to support an energy source with a 20% capacity rating.
Yes, there are many ironies on the anniversary of the IRA. They mainly demonstrate the mantra – follow the money. When the government chooses to throw around billions of dollars in subsidies, even people who opposed the legislation for the proper reasons are not opposed to racing to the trough to suck up some of the government’s largess. Some IRA promoters are upset that oil and gas companies are partaking in the subsidies. But they are getting the money for projects the IRA wants to promote, and that need the skills and technological competence of the oil and gas companies. That is the real irony.


Yes, amazing how irony can actually be the reverse of those claiming irony.
Thanks, Kit.