Energy Musings - August 13, 2024
The shockingly high capacity clearing prices for 2025/2026 in PJM's grid auction reflect the exploding demand from data centers and AI power needs. Electricity prices are going up.
PJM Bids Send Warning About Grid Capacity
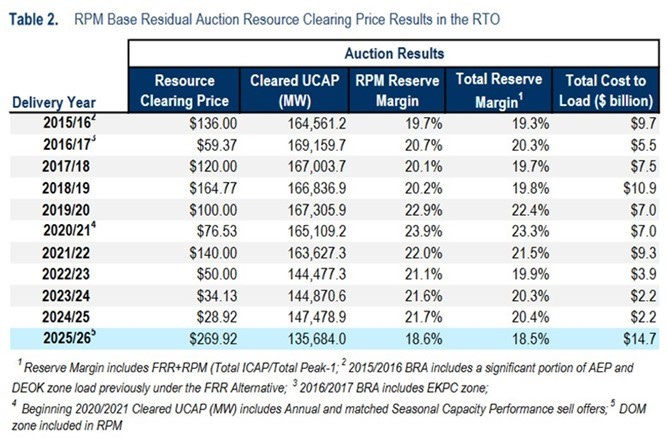
The recent results of PJM Interconnection’s 2025/2026 Reliability Pricing Model Base Residual Auction sent warning signals to customers and electricity company executives in the region. The clearing prices were at record highs. Across the PJM regional transmission organization’s (RTO) geography, the price was $269.92 per megawatt-day (MW-day). That was more than a ninefold increase from the prior year’s auction price of $28.92/MW-day.
Two regions within the RTO’s territory – the Baltimore Gas & Electric (BGO) zone and Dominion Energy’s share of Virginia and North Carolina – saw substantially higher auction clearing prices. The prices for those two regions shocked everyone. BGE’s clearing price of $466.35 was up from $73 last year, nearly a six-and-a-half-fold increase. Dominion’s price was $444.26 but there was no comparison price for last year.
The PJM Capacity Auction produced eye-popping prices that have people searching for the reasons.
The total cost to consumers in PJM will jump to $14.7 billion next year. That is up from this year’s $2.2 billion cost derived from last year’s sale! Just within the PJM footprint, the chief financial office of Exelon, which owns six utilities with 10.5 million customers in Delaware, Illinois, Maryland, New Jersey, Pennsylvania, and Washington, D.C., told UtilityDive that customers could expect double-digit rate hikes. And you thought inflation was going away.
According to CNN earlier this year:
“Some 21.2 million households – or more than 1 in 6 in the US – owed money on their electricity bills in December, up from 20.1 million a year earlier. Electricity and natural gas arrearages combined hit $20.3 billion, up from $17.8 billion the year before.”
With PJM customers facing double-digit rate hikes, consistent with reports from utility companies elsewhere in the nation, one must fear more households will fall behind on their utility bills. Is there a solution other than utility and state government support programs? In either case, the unpaid utility bills are socialized among other utility ratepayers and state taxpayers.
The Price Problem
Across the nation, the operators of RTOs and independent systems operators (ISOs) that oversee the nation’s electricity grids are increasingly warning about greater grid instability and increased risk of blackouts. These warnings come as energy policymakers push for more renewable electricity rather than hydrocarbon-generated electricity. The push is driven by state clean energy mandates in response to fear about climate change.
The PJM auction was a stark warning about a tightening supply/demand balance for electricity generation and consumption in the region. The tightening is also manifested by the sharp drop in the power reserve margin. As the chart shows, the reserve margin is the lowest in the past decade of auctions. The 3% drop in the RPM Reserve Margin and the 2% decline in the Total Reserve Margin reflects the deteriorating supply and growing demand situation. Given that both trends are likely to continue, PJM executives and the operating utilities in the region should be concerned.
The lowest reserve margin in a decade has utilities in PJM concerned about grid stability and possible blackouts.
According to a PJM executive, the high auction prices reflect tighter electricity supply and demand. Capacity availability in PJM has been impacted by generating plant retirements, new market rules to better reflect risks from extreme weather, and new resource accreditation measures designed to reflect the amount of output a resource can deliver during grid stress.
The auction saw about 6,600 megawatts (MW) less capacity bid than in last year’s sale. The decline reflected plant retirements and must-offer exceptions for power plants heading toward shutdown. At the same time, PJM’s peak load is projected to increase by about 3,000 MW.
The capacity mix purchased provided insight into the growing concern utilities have about grid reliability. According to PJM, natural gas-fired plants account for 48% of the purchased capacity. Nuclear represents 21%, coal is 18%, demand response is 5%, hydropower is 4%, solar and wind are 1% each, and 2% comes from other sources. Hydrocarbon power represented 87% of all the capacity purchased, suggesting the system’s tighter supply/demand balance and shrinking reserve margin have put a premium on dispatchable power supplies.
That concern becomes more apparent when we look at the planned capacity projects seeking to become part of the PJM supply. The chart shows that of the 72 MW of new supply for 2024 and 2025, over 90% is renewable and batteries. These are non-dispatchable power supplies. Merchant transmission, or supplies from outside the region, accounted for 5.7% of the new power supply. Natural gas-generated power was most of the 2.4% of the Other supply category.
Only 2.4% of projected capacity coming into PJM is dispatchable power raising concerns about grid stability.
It is important to note that of the capacity purchased in the auction, about 110 MW represented new generation and 755 MW of power from uprated existing or planned generating plants. The new generation is about one-third of the amount tendered in last year’s sale. It represents the impact of the low auction clearing prices for the past three years. Low prices discourage capital investment in new generating capacity if there is a risk it will not earn a reasonable return. This is especially true for renewable generation. If it does not have government subsidies providing guaranteed returns regardless of what the market price for the electricity is it will not be built.
Responses to the auction results were not surprising. William Scherman, a partner at Vinson & Elkins law firm who represents utilities, told UtilityDive “We are finally seeing prices reflect demand, which is increasing at a growing rate.” Additionally, he said, “One of the key takeaways from the auction results is that the recent rash of fossil fuel plant closures is not the reliability red-herring as some people have claimed, since the reliability red-herring has come home to roost.” In other words, the low reserve margin and a shrinking supply of dispatchable power jeopardize grid reliability.
The Electric Power Supply Association (EPSA) said it expected the prices to be a signal to power plant developers to build power plants within the PJM footprint. EPSA President and CEO Todd Snitchler said in a statement. “While encouraging, the results of one auction do not establish a trend; however, this auction does suggest that the initial market reforms instituted by PJM to address the misalignment [of retiring power plants with replacement generation] had a positive impact.”
On the other side, Jon Gordon, a director of Advanced Energy United, a clean energy trade group, said “PJM didn’t prepare for an energy transition we all saw coming and now consumers are going to pay the price.” He further stated. “PJM fell behind on interconnection and long-term transmission planning years ago and now the problems are just cascading and piling up.”
While it is easy to say, “I told you so,” PJM’s problems are similar to those plaguing all utilities. The world of low or no electricity demand growth is over. It isn’t coming from electric vehicles and home heating; it is coming from new technologies with huge power appetites.
Rapid Demand Growth Dynamic
Power-hungry crypto-mining and data centers are the problem. The growth in Artificial Intelligence (AI) use is a major electricity demand driver. PJM is a poster child for these new power demands. It has four of the top 15 states in the nation with data center power exceeding 10% of total electricity consumption, which includes Virginia, the number one state.
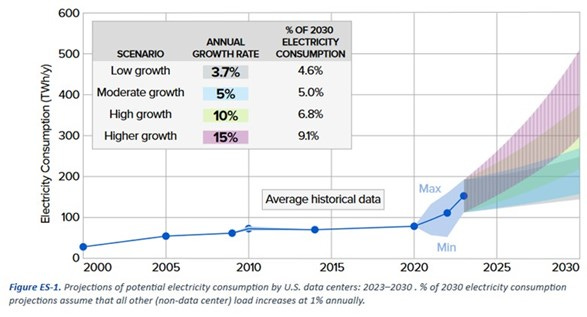
Earlier this year, the Electric Power Research Institute (EPRI) analyzed the impact of data center growth and AI use on electricity demand in 2030. Their report was titled: Powering Intelligence: Analyzing Artificial Intelligence and Data Center Energy Consumption. The following chart from the report shows how power demand has increased for the past 23 years.
Data centers and AI are driving power demand.
Data center power consumption growth in the early 2000s was driven by the rapid expansion of the internet and the dot-com boom. However, between 2010 and 2020, electricity growth flattened as data center demand increases were offset by rapid improvements in energy efficiency in their operation and by the shift from small data centers to more efficient cloud facilities. The recent demand increase came from the increased use of cloud services, big data analytics, and AI. Additionally, operational efficiency gains slowed.
Power Usage Effectiveness (PUE) is a metric quantifying the energy efficiency of a data center. It is calculated by dividing the total energy used by the energy consumed by the IT equipment alone. A lower PUE indicates higher efficiency, with 1.0 implying all the energy consumed was for computational purposes.
In 2007, the average data center PUE was 2.5, but four years later it was slightly under 2.0. By 2014, the PUE was down to 1.65. While servers and data center server cooling systems have made significant improvements, the increased computational needs offset further effectiveness gains. Expectations are that PUE improvements will continue to flatline as energy efficiency gains are offset by increased computing needs.
Future Demand Growth
EPRI created four scenarios for electric power demand growth for 2023-2030. The following graph and chart show those scenarios and their forecasts for electricity demand driven by more data centers and their power needs. In 2023, data centers consumed 4% of national power use. In EPRI’s low growth scenario, data center power grows to 4.6% of the nation’s electricity consumption in 2030. However, their high growth scenario has power consumption increasing to 9.1% of total power use, more than doubling data centers’ current power share.
Data center power could account for 9% of the nation’s electricity consumption by 2030.
Fifteen states account for 80% of the nation’s data center power needs. The number one data center state is Virginia where the load accounted for a quarter of the state’s electricity consumption. This tendency for regional concentration of data centers and their power is true worldwide. For example, data center power needs in Ireland will account for almost one-third of total electricity use by 2026.
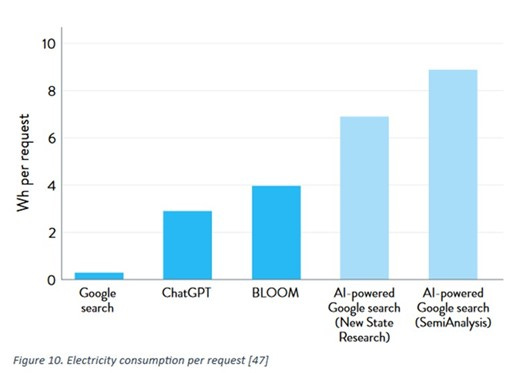
The impact of AI’s growth cannot be underestimated when assessing future electricity needs. In 2023, AI applications were estimated to use only 10%-20% of data center electricity. However, that share is rapidly growing. A typical Google search may use about 0.3 watt-hours. A ChatGPT inquiry can use 2.9 watt-hours, nearly 10 times more power. Other AI technologies have greater power usage than ChatGPT. Image, audio, and video AI generation are growing. Their computational intensity will drive data center power use even more. That trend is shown in the following chart.
AI applications are huge power consumers, dwarfing the power used in Google searches.
To meet the anticipated needs of AI, more data centers are being built and new ones are larger. New centers have capacities creating 100 to 1,000 MW of electricity demand. That is the equivalent electricity usage of 80,000 to 800,000 homes or the power needs of small cities.
Putting this power demand into perspective, the U.S. power grid has 1.3 terawatts of capacity, spread over 25,000 facilities with an average size of 50 MW, all built over the past century. An analysis of the generators shows that the mean average power plant is 10x the median, and 50% of all the capacity comes from a core of 1,000 facilities representing 5% of the facilities by number. The average size of those core facilities is 500 MW. Thus, a super data center needs the power output of two average core generators.
Since the connection times for these new data centers extend to two or more years, utilities can see future demand growth. However, because of permitting challenges, they barely have enough time to add the needed generation capacity. The EPRI report assessed the importance of data centers to individual state electricity consumption. Their map of the Lower 48 states shows that 44 states are seeing data centers being constructed which will impact their future power needs. Four of the top 15 states are within PJM’s footprint: Virginia, Pennsylvania, New Jersey, and Illinois.
Here are the 15 states leading the nation in data center power consumption.
The EPRI report detailed the growth in the number of data centers. It reported that “as of March 2024, there were approximately 10,655 data centers globally; half of them, 5,381, were in the United States. Just over three years ago, in January 2021, there were approximately 8,000 data centers, with about one-third of them in the United States.”
Data centers come in two sizes – small or large. Small-scale data centers represent about 10% of total data center power consumption. These small-scale data centers focus on localized operations serving small businesses, government facilities, and departments of large corporations. Small-scale data centers are often found in server rooms and closets in buildings and “edge data centers.” These edge data centers are located on the outer edges of networks to bring computing capacity closer to users who are geographically remote from large cloud data centers.
Small-scale data centers have power needs ranging from 500 kilowatts to 2 MW. They represent about half of all servers. Forecasts call for the edge data center market to grow at a 22% compound annual rate by 2030.
Large-scale data centers are designed to serve extensive operations including multiple businesses and even entire industries. They are located close to their customers. There are three types of large-scale data centers. They include Enterprise data centers – owned and operated by a single company and represent 20%-30% of the total load; Co-location data centers – several businesses rent space to house their servers and other IT hardware, and share energy and cooling infrastructure; and Hyperscale data centers – supporting the operations of vast computing needs of companies such as Amazon AWS, Google Cloud, and Microsoft Azure. Hyperscale and co-location data centers represent 60%-70% of U.S. data center power consumption.
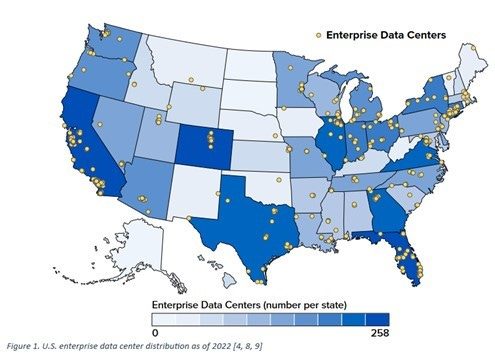
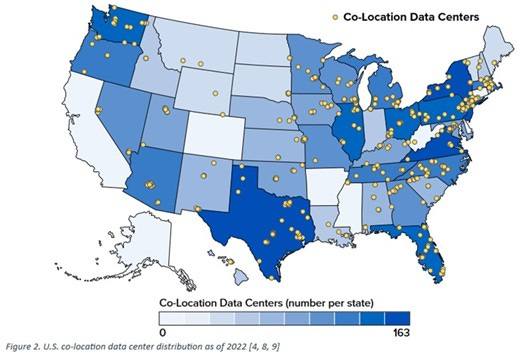
The EPRI report included three U.S. maps showing the locations of Enterprise, Co-location, and Hyperscale data centers. The maps show the geographic concentration of these data centers and why certain states are experiencing rapid electricity demand. Many states are home to specific industries and businesses which explains why power demand growth is concentrated in 15 states with an additional 29 states rapidly growing.
The geographic concentration of data centers explains why a few states are experiencing significant electricity demand growth.
Co-location data centers are less power-intensive but still an important source of electricity demand growth.
Hyperscale data centers are the biggest power users because of their owners such as Amazon, Google, and Microsoft.
Given the location of these large-scale data centers, it is not surprising that the PJM grid is experiencing rapid electricity growth. As PJM retires coal and other dispatchable hydrocarbon-fueled generators and replaces that capacity with part-time renewable energy, it will not be surprising to see future capacity auctions producing high power prices. Additionally, grid stability issues will become a greater concern.
Because of the low capacity output of renewable energy, the power reserve margin will continue to shrink. Renewable power forces substantially greater investment to produce the equivalent output of dispatchable power sources. With solar and wind capacity factors at 20% to 40%, respectively, to attain the output levels of hydrocarbon-powered generators, renewable energy investment must rise by 2.5-4.5 times. That is a wasteful investment scenario, the cost of which will burden ratepayers in the PJM region.
If the various state mandates for clean energy force substantial conversions of vehicles and home heating to electricity, the demand growth for the PJM region will be even higher than projected by the growth in data centers and AI use. Residents in the PJM region should buckle up for a steady dose of double-digit electricity rate hikes.


